| Firm size | Count | Percent of firms | totalemployees | employeepercent |
|---|---|---|---|---|
| 1 | 13097 | 38.8% | 13097 | 6.4% |
| 2-4 | 13539 | 40.1% | 33985 | 16.7% |
| 5-9 | 3428 | 10.2% | 22225 | 10.9% |
| 10-20 | 1962 | 5.8% | 27129 | 13.3% |
| 21-50 | 1139 | 3.4% | 35272 | 17.4% |
| 51-100 | 353 | 1% | 24717 | 12.2% |
| 101+ | 207 | 0.6% | 46828 | 23% |
Four bespoke sectors using Companies House data (South Yorkshire)
What’s this?
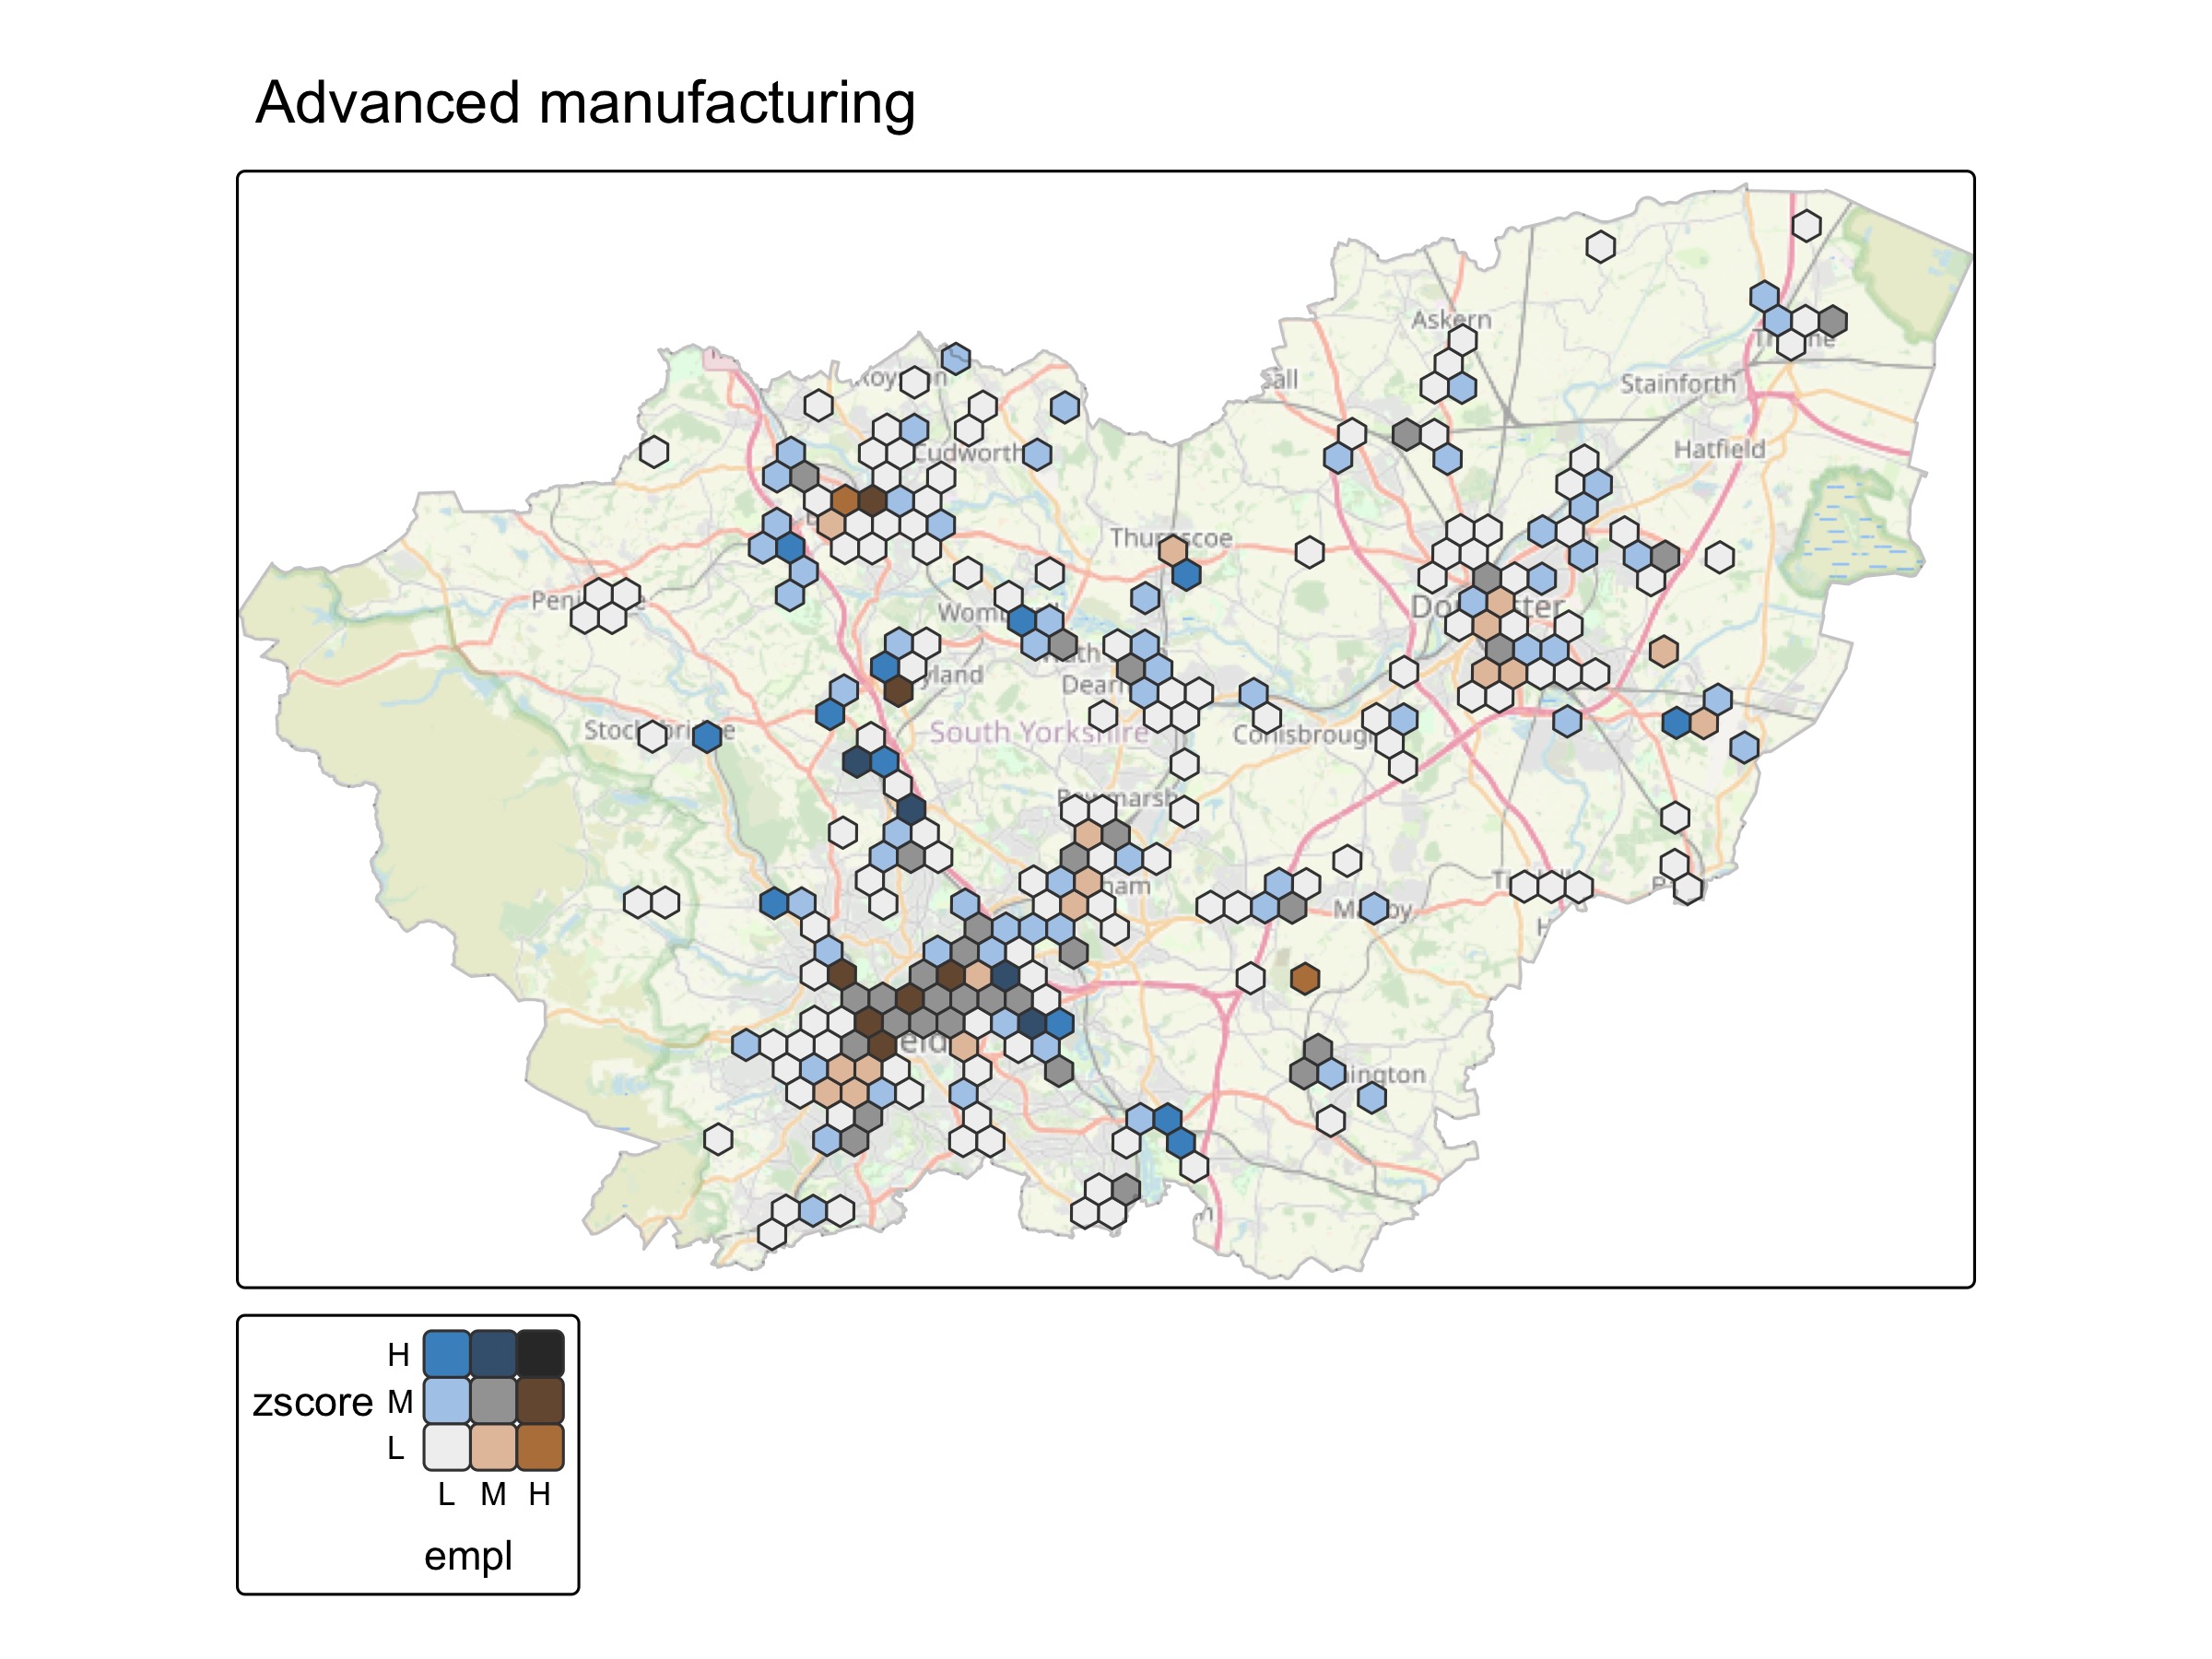
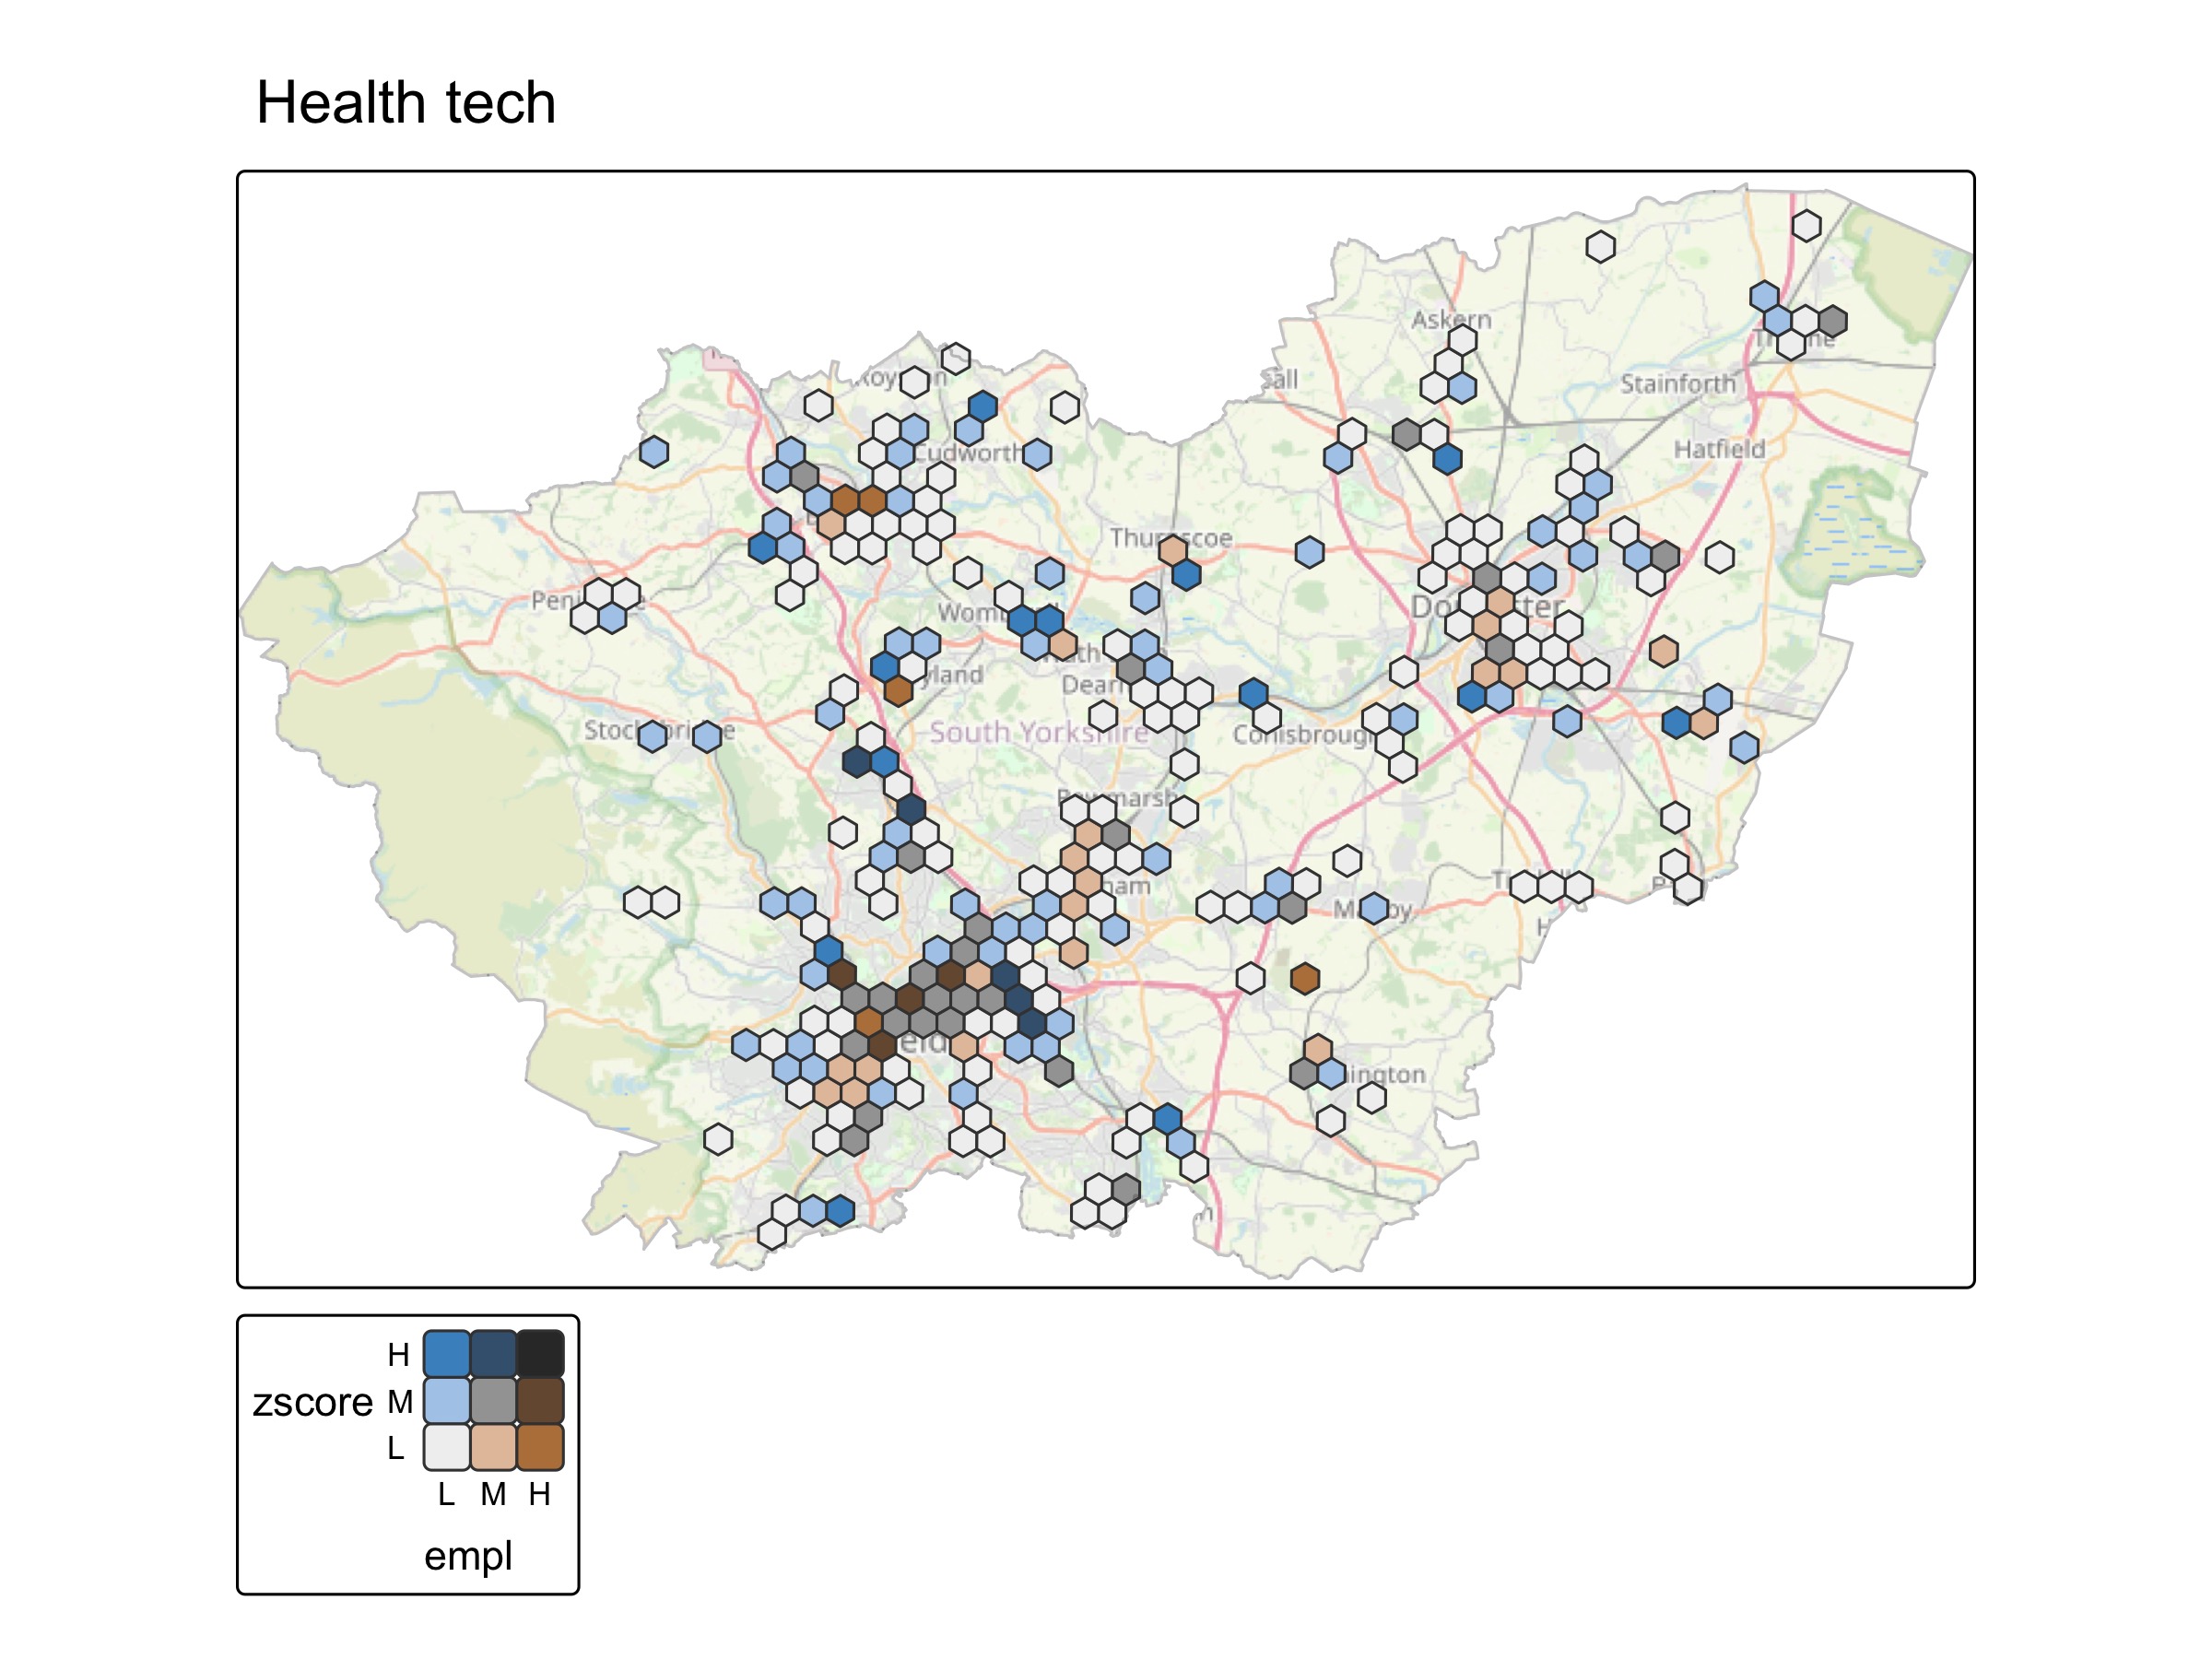
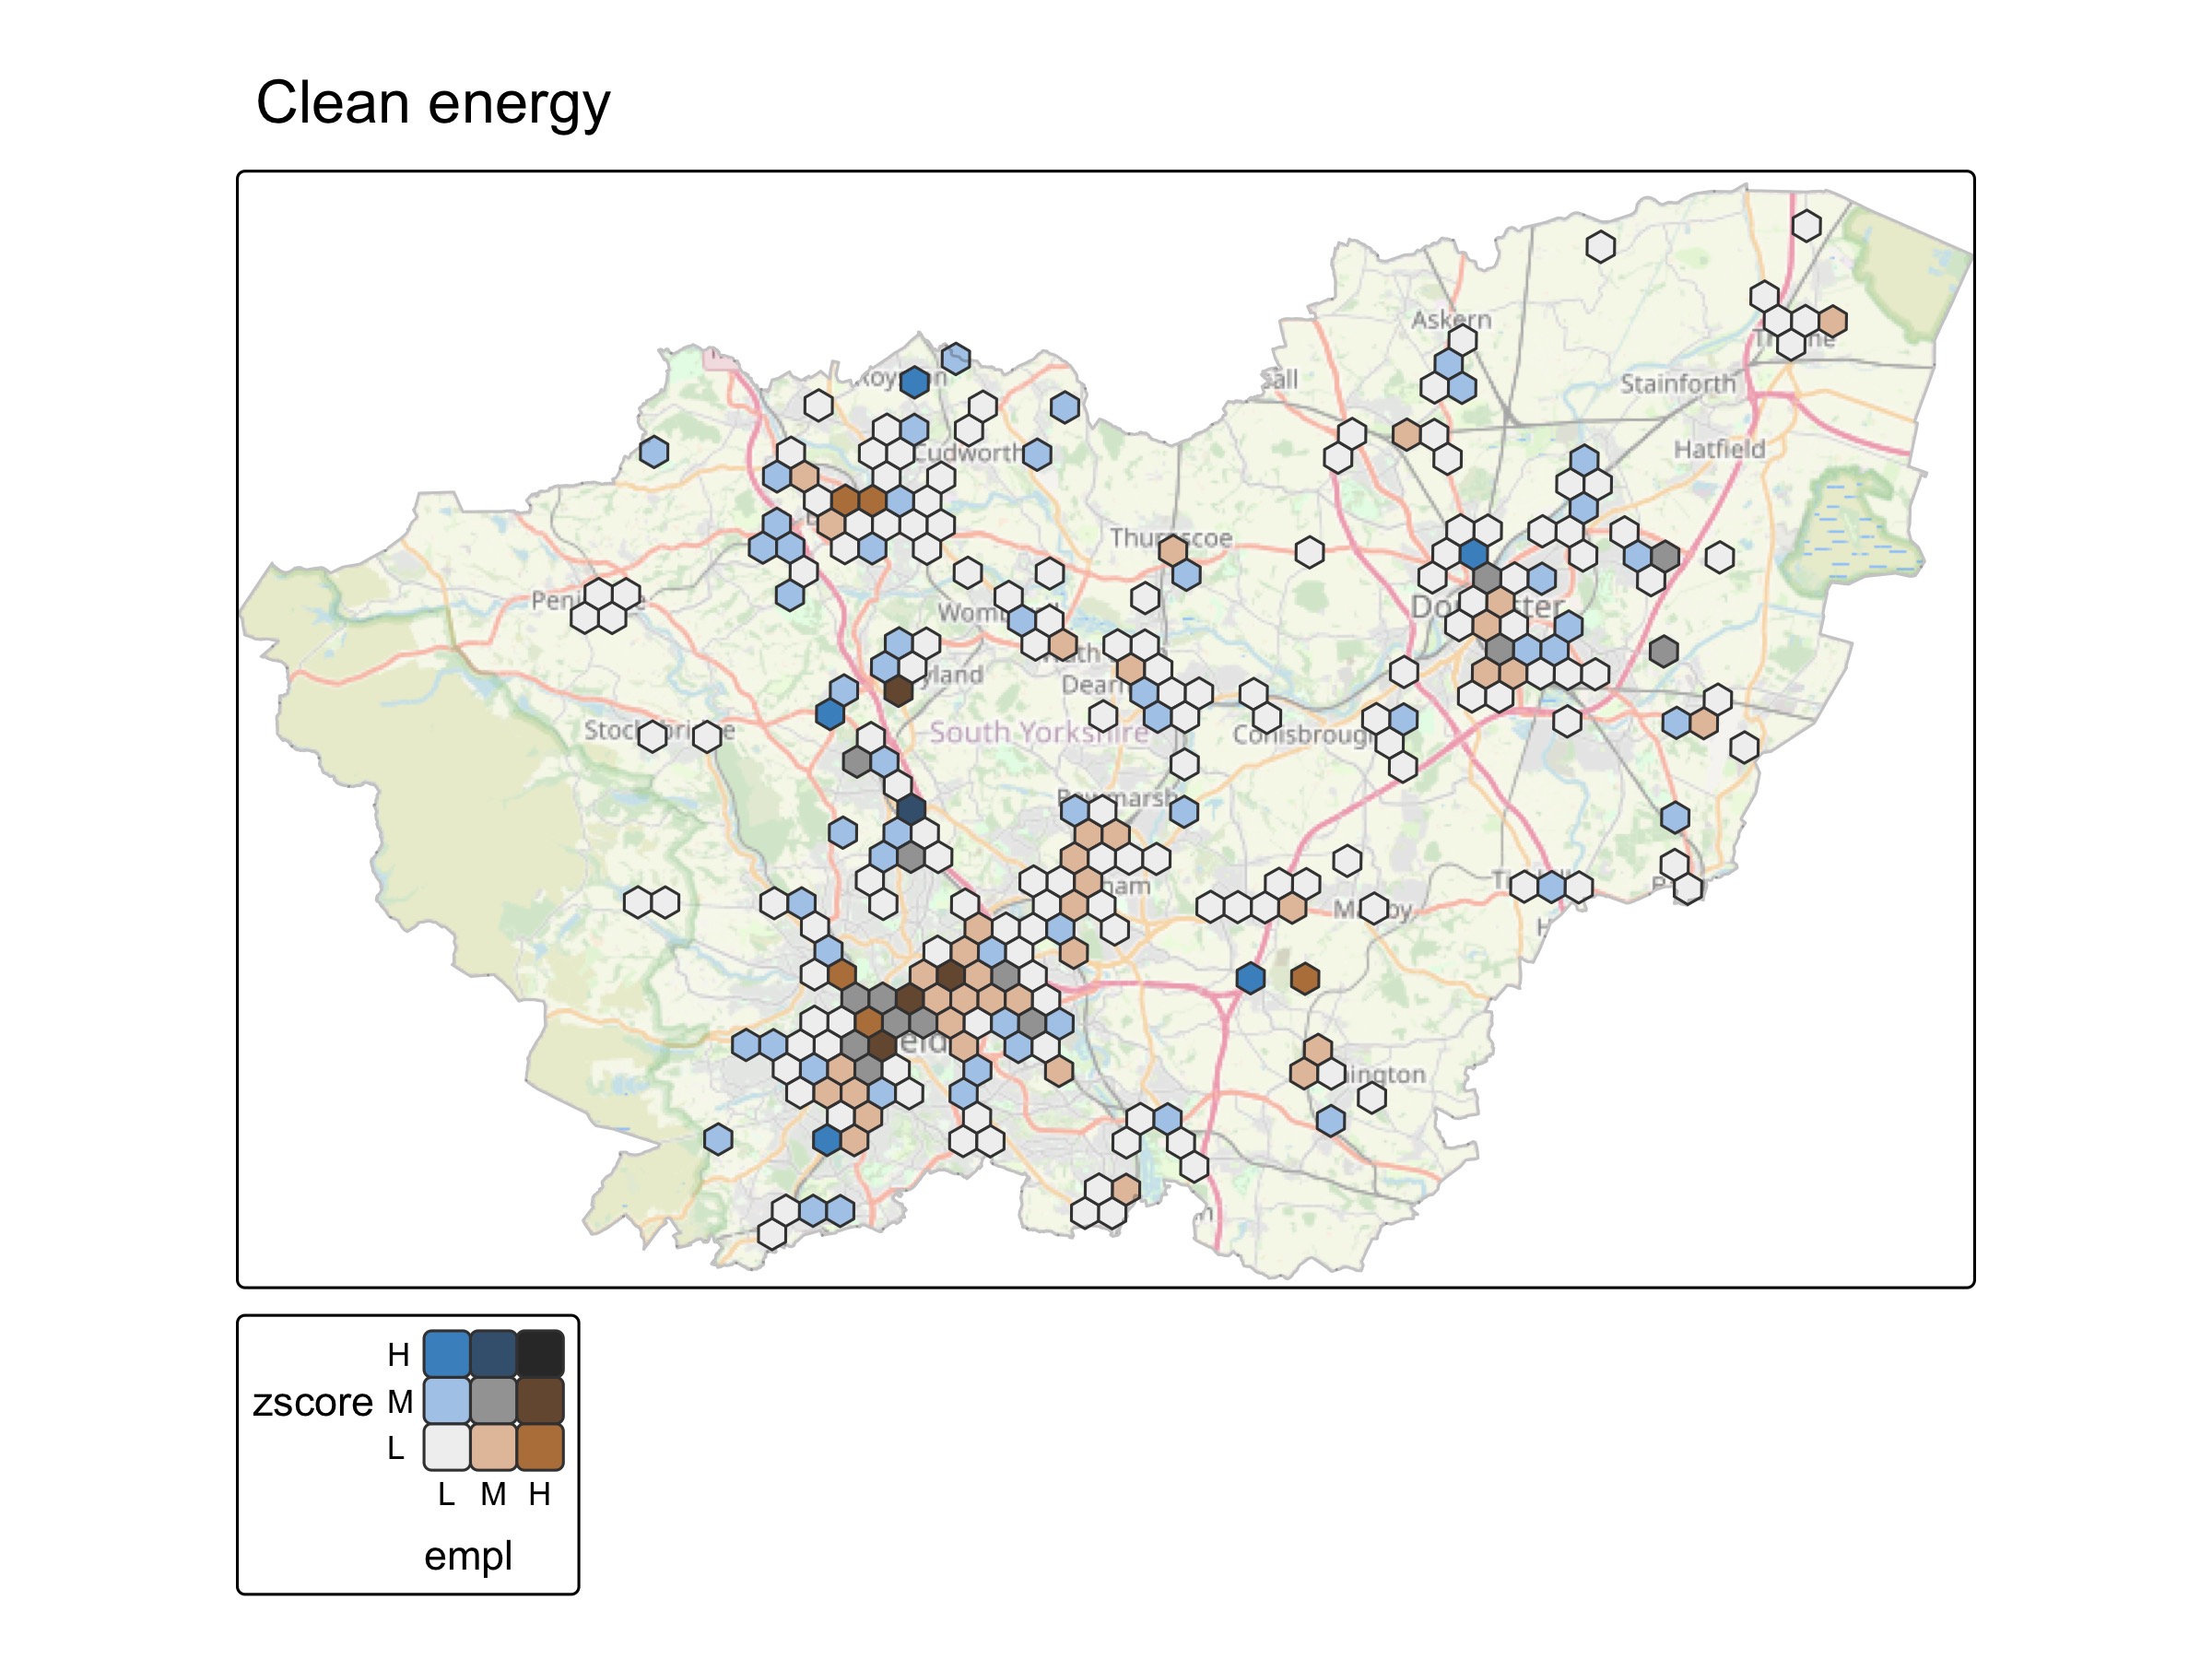
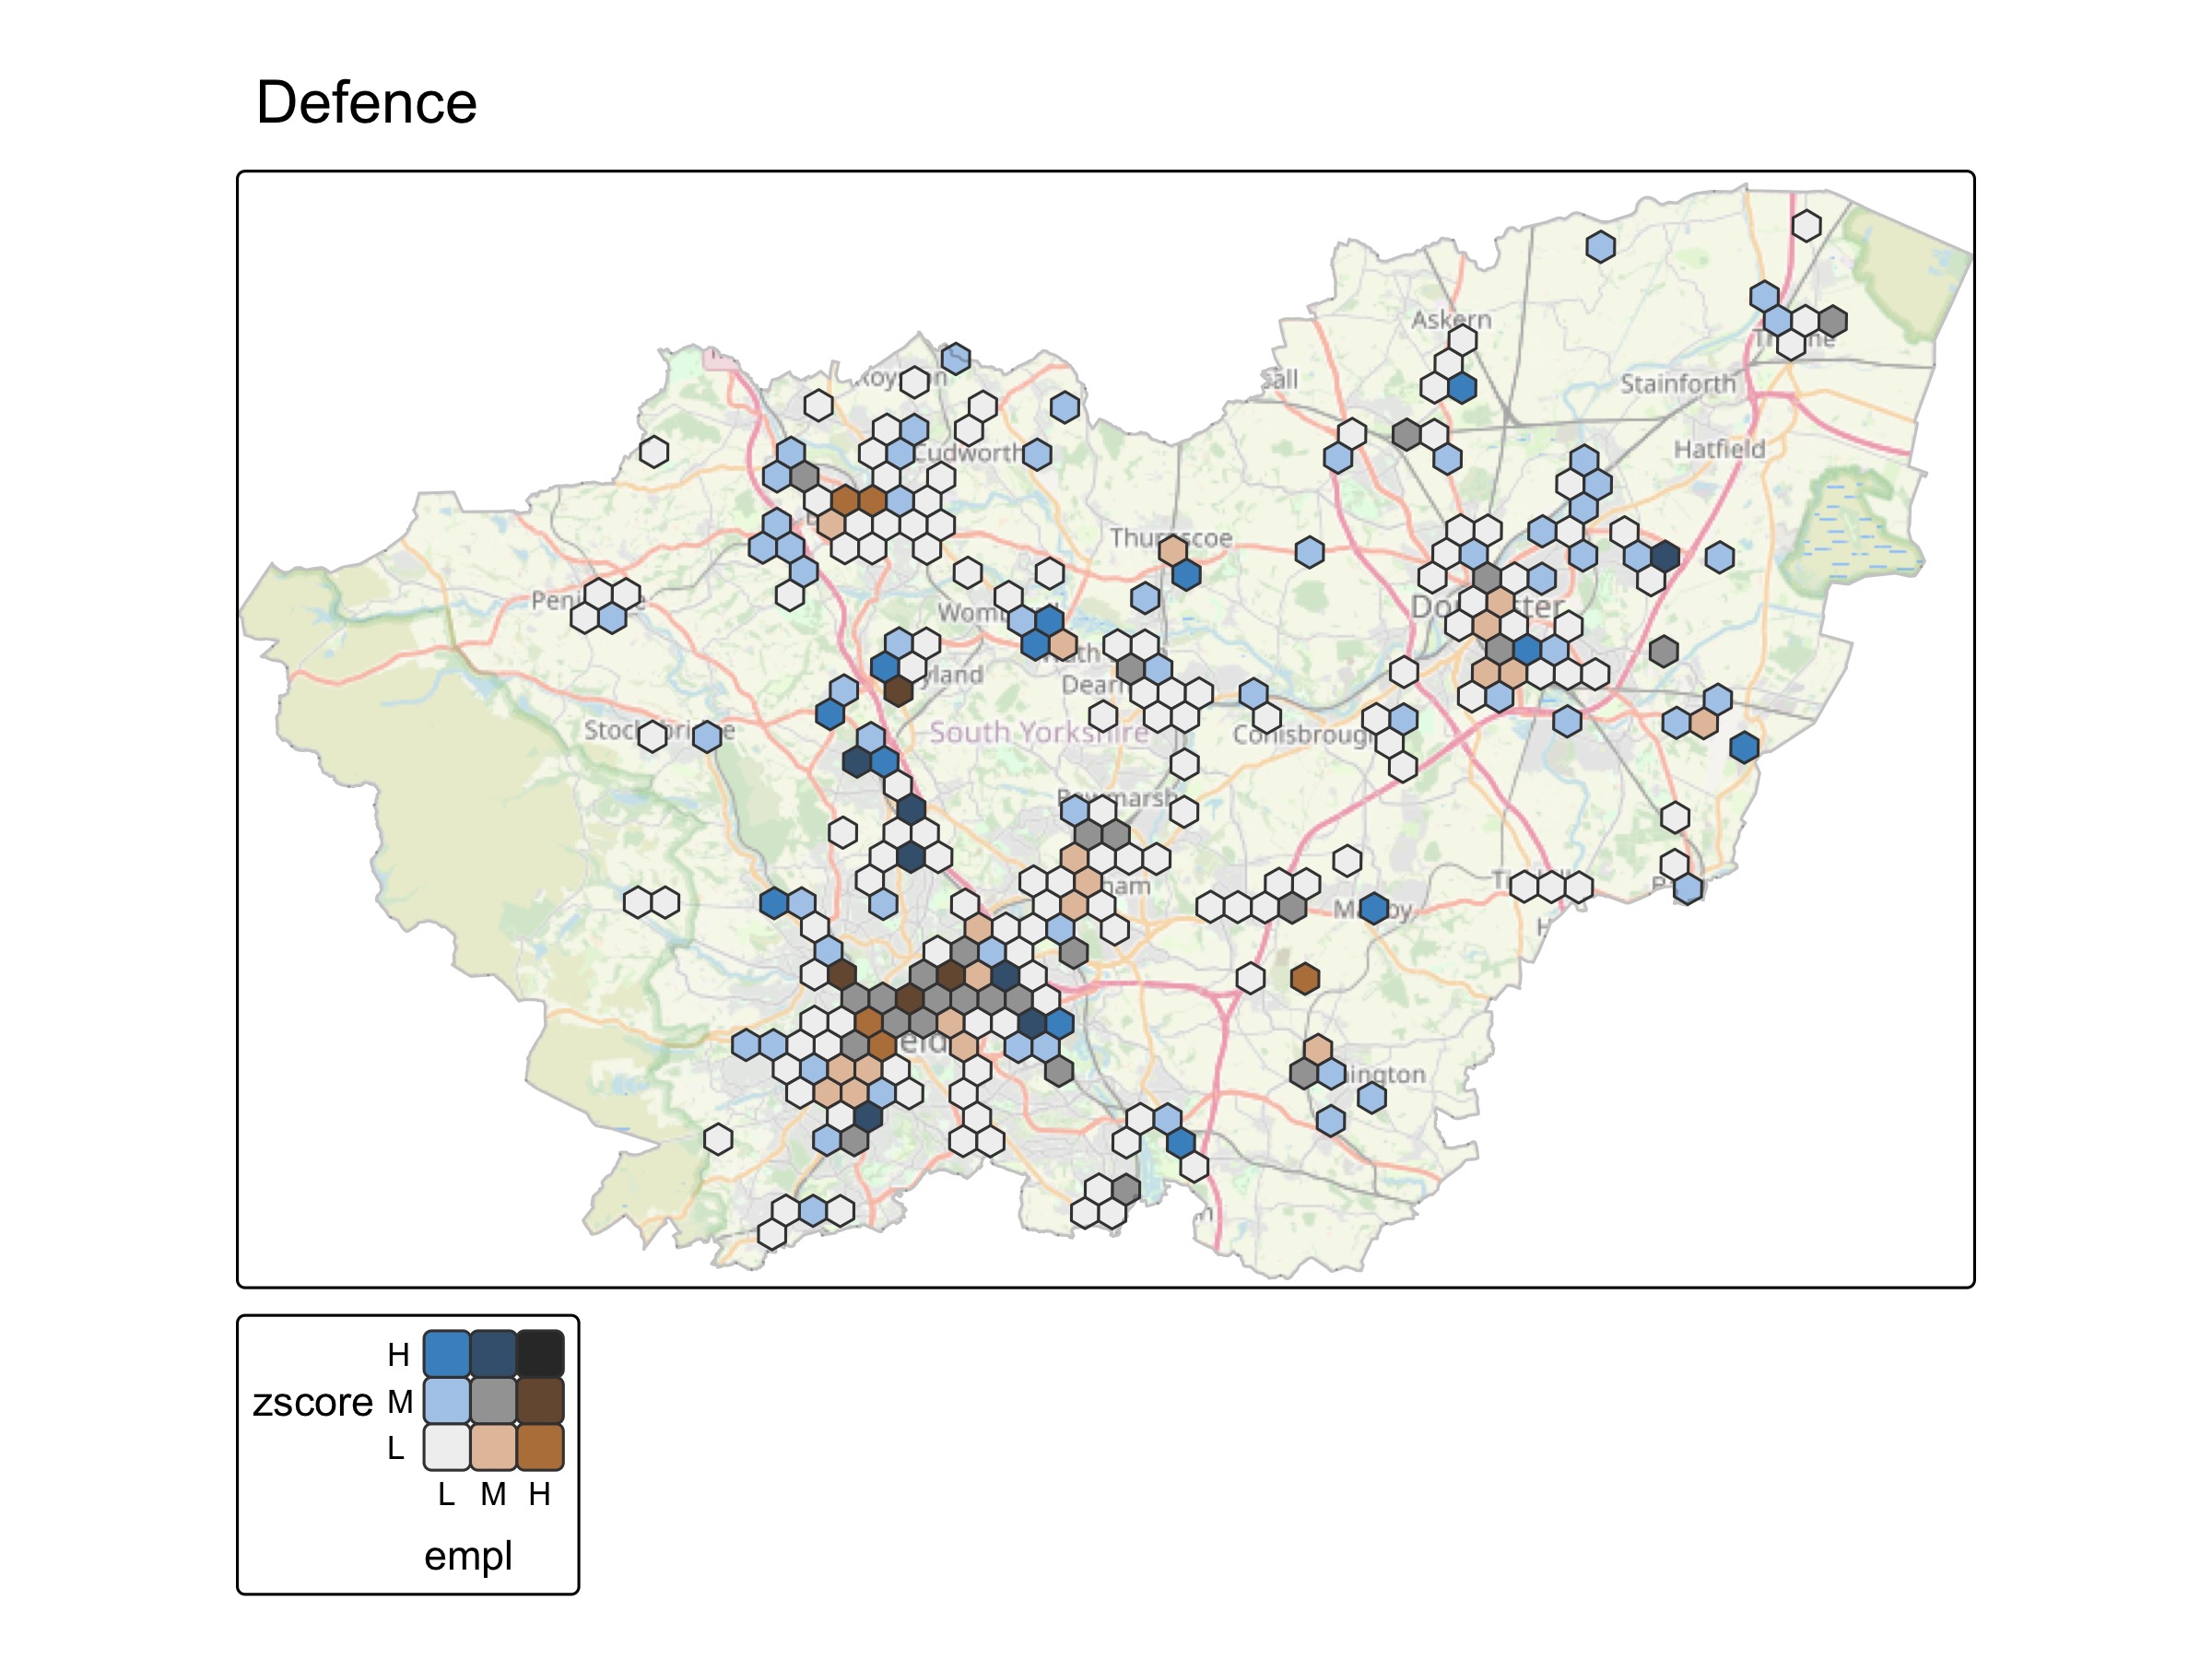
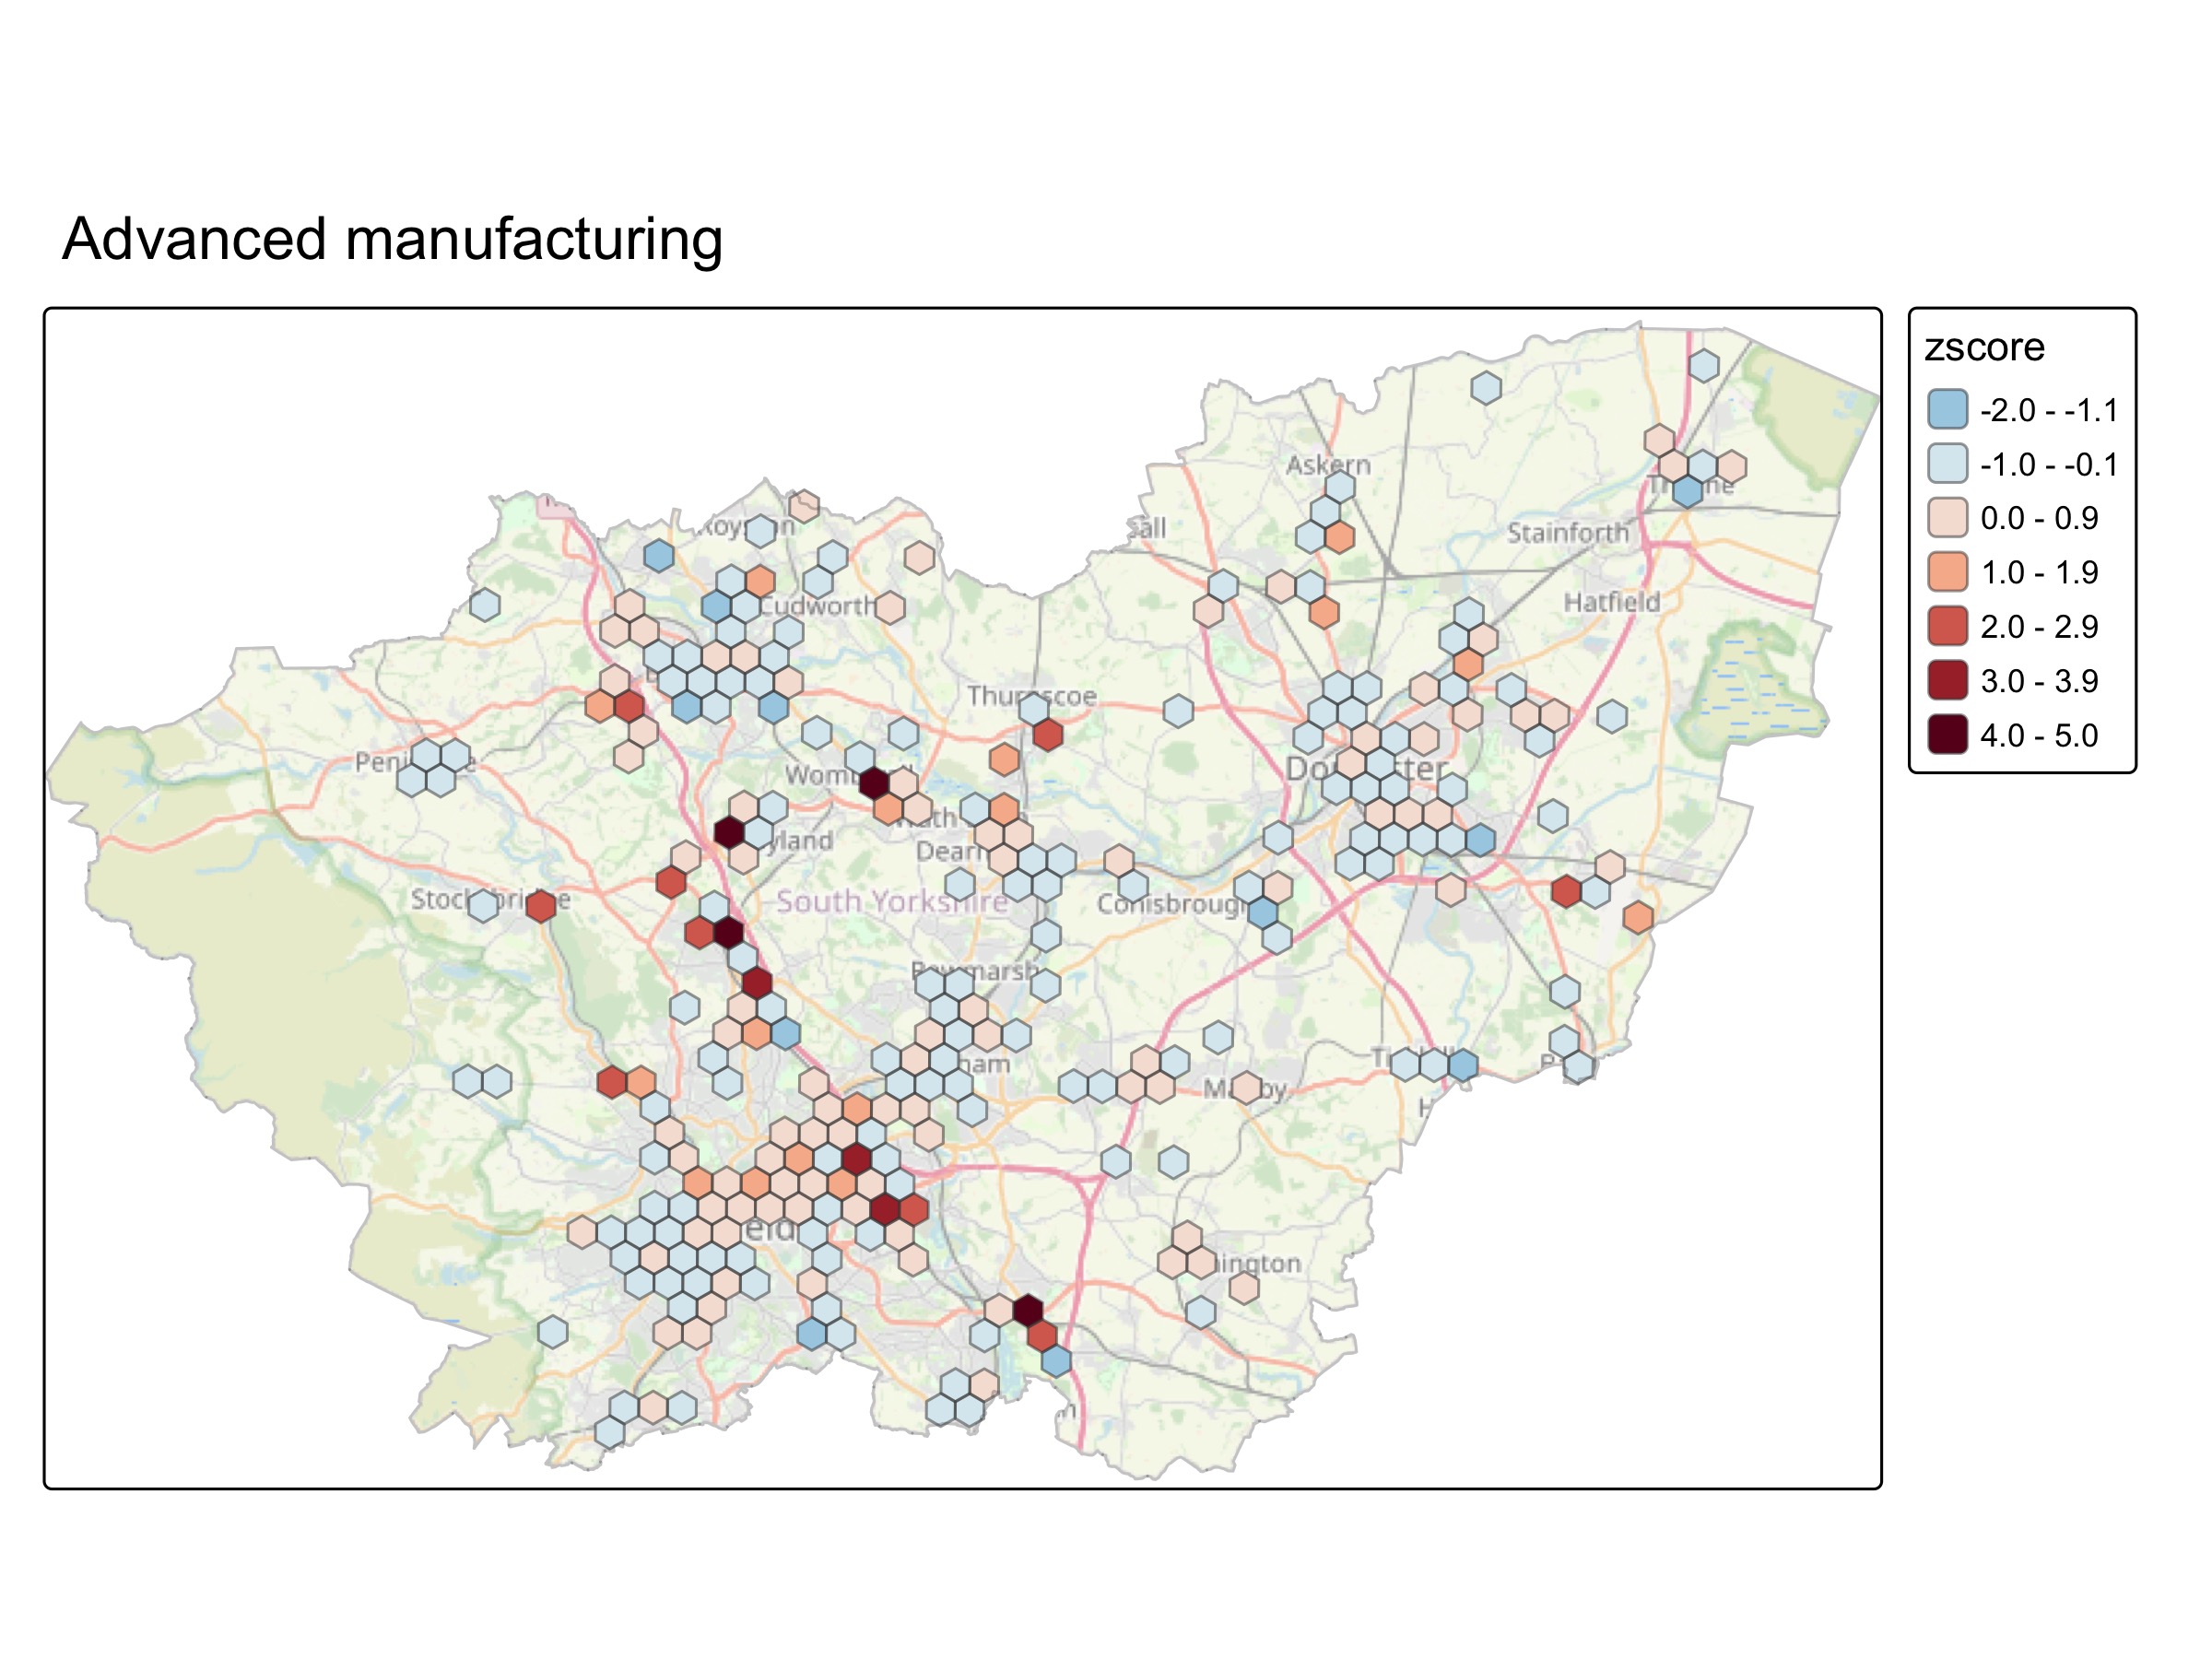
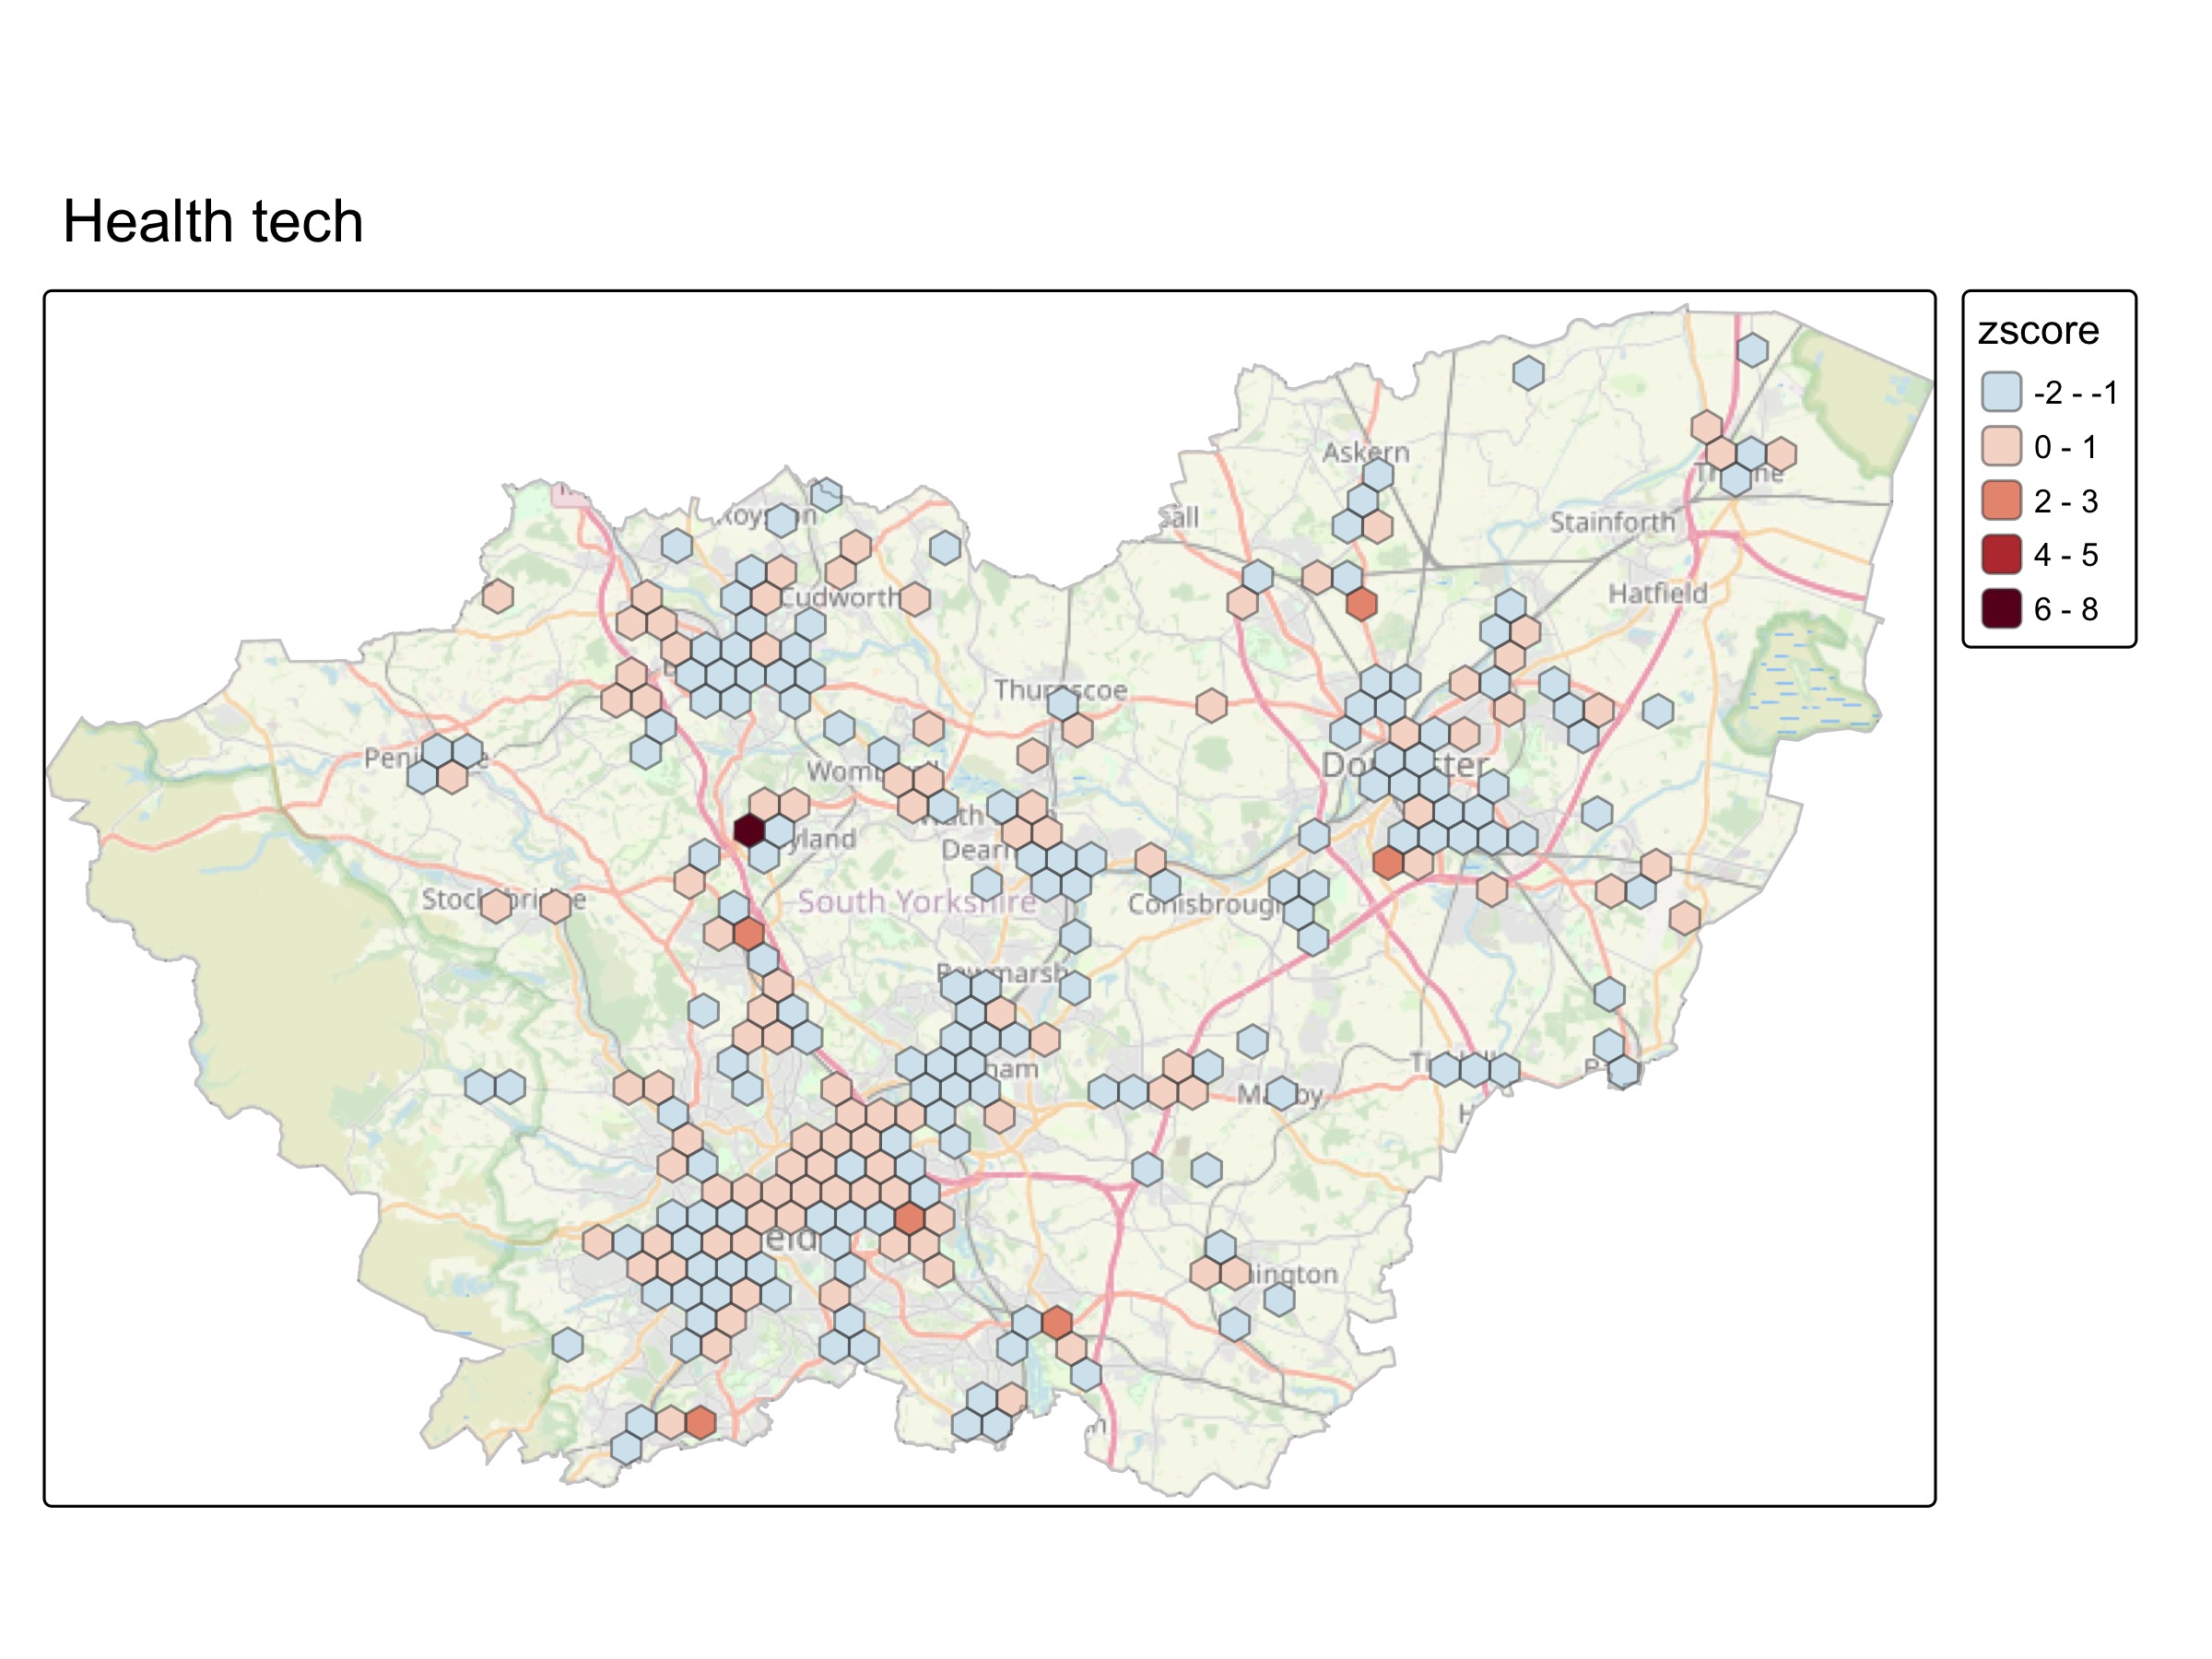
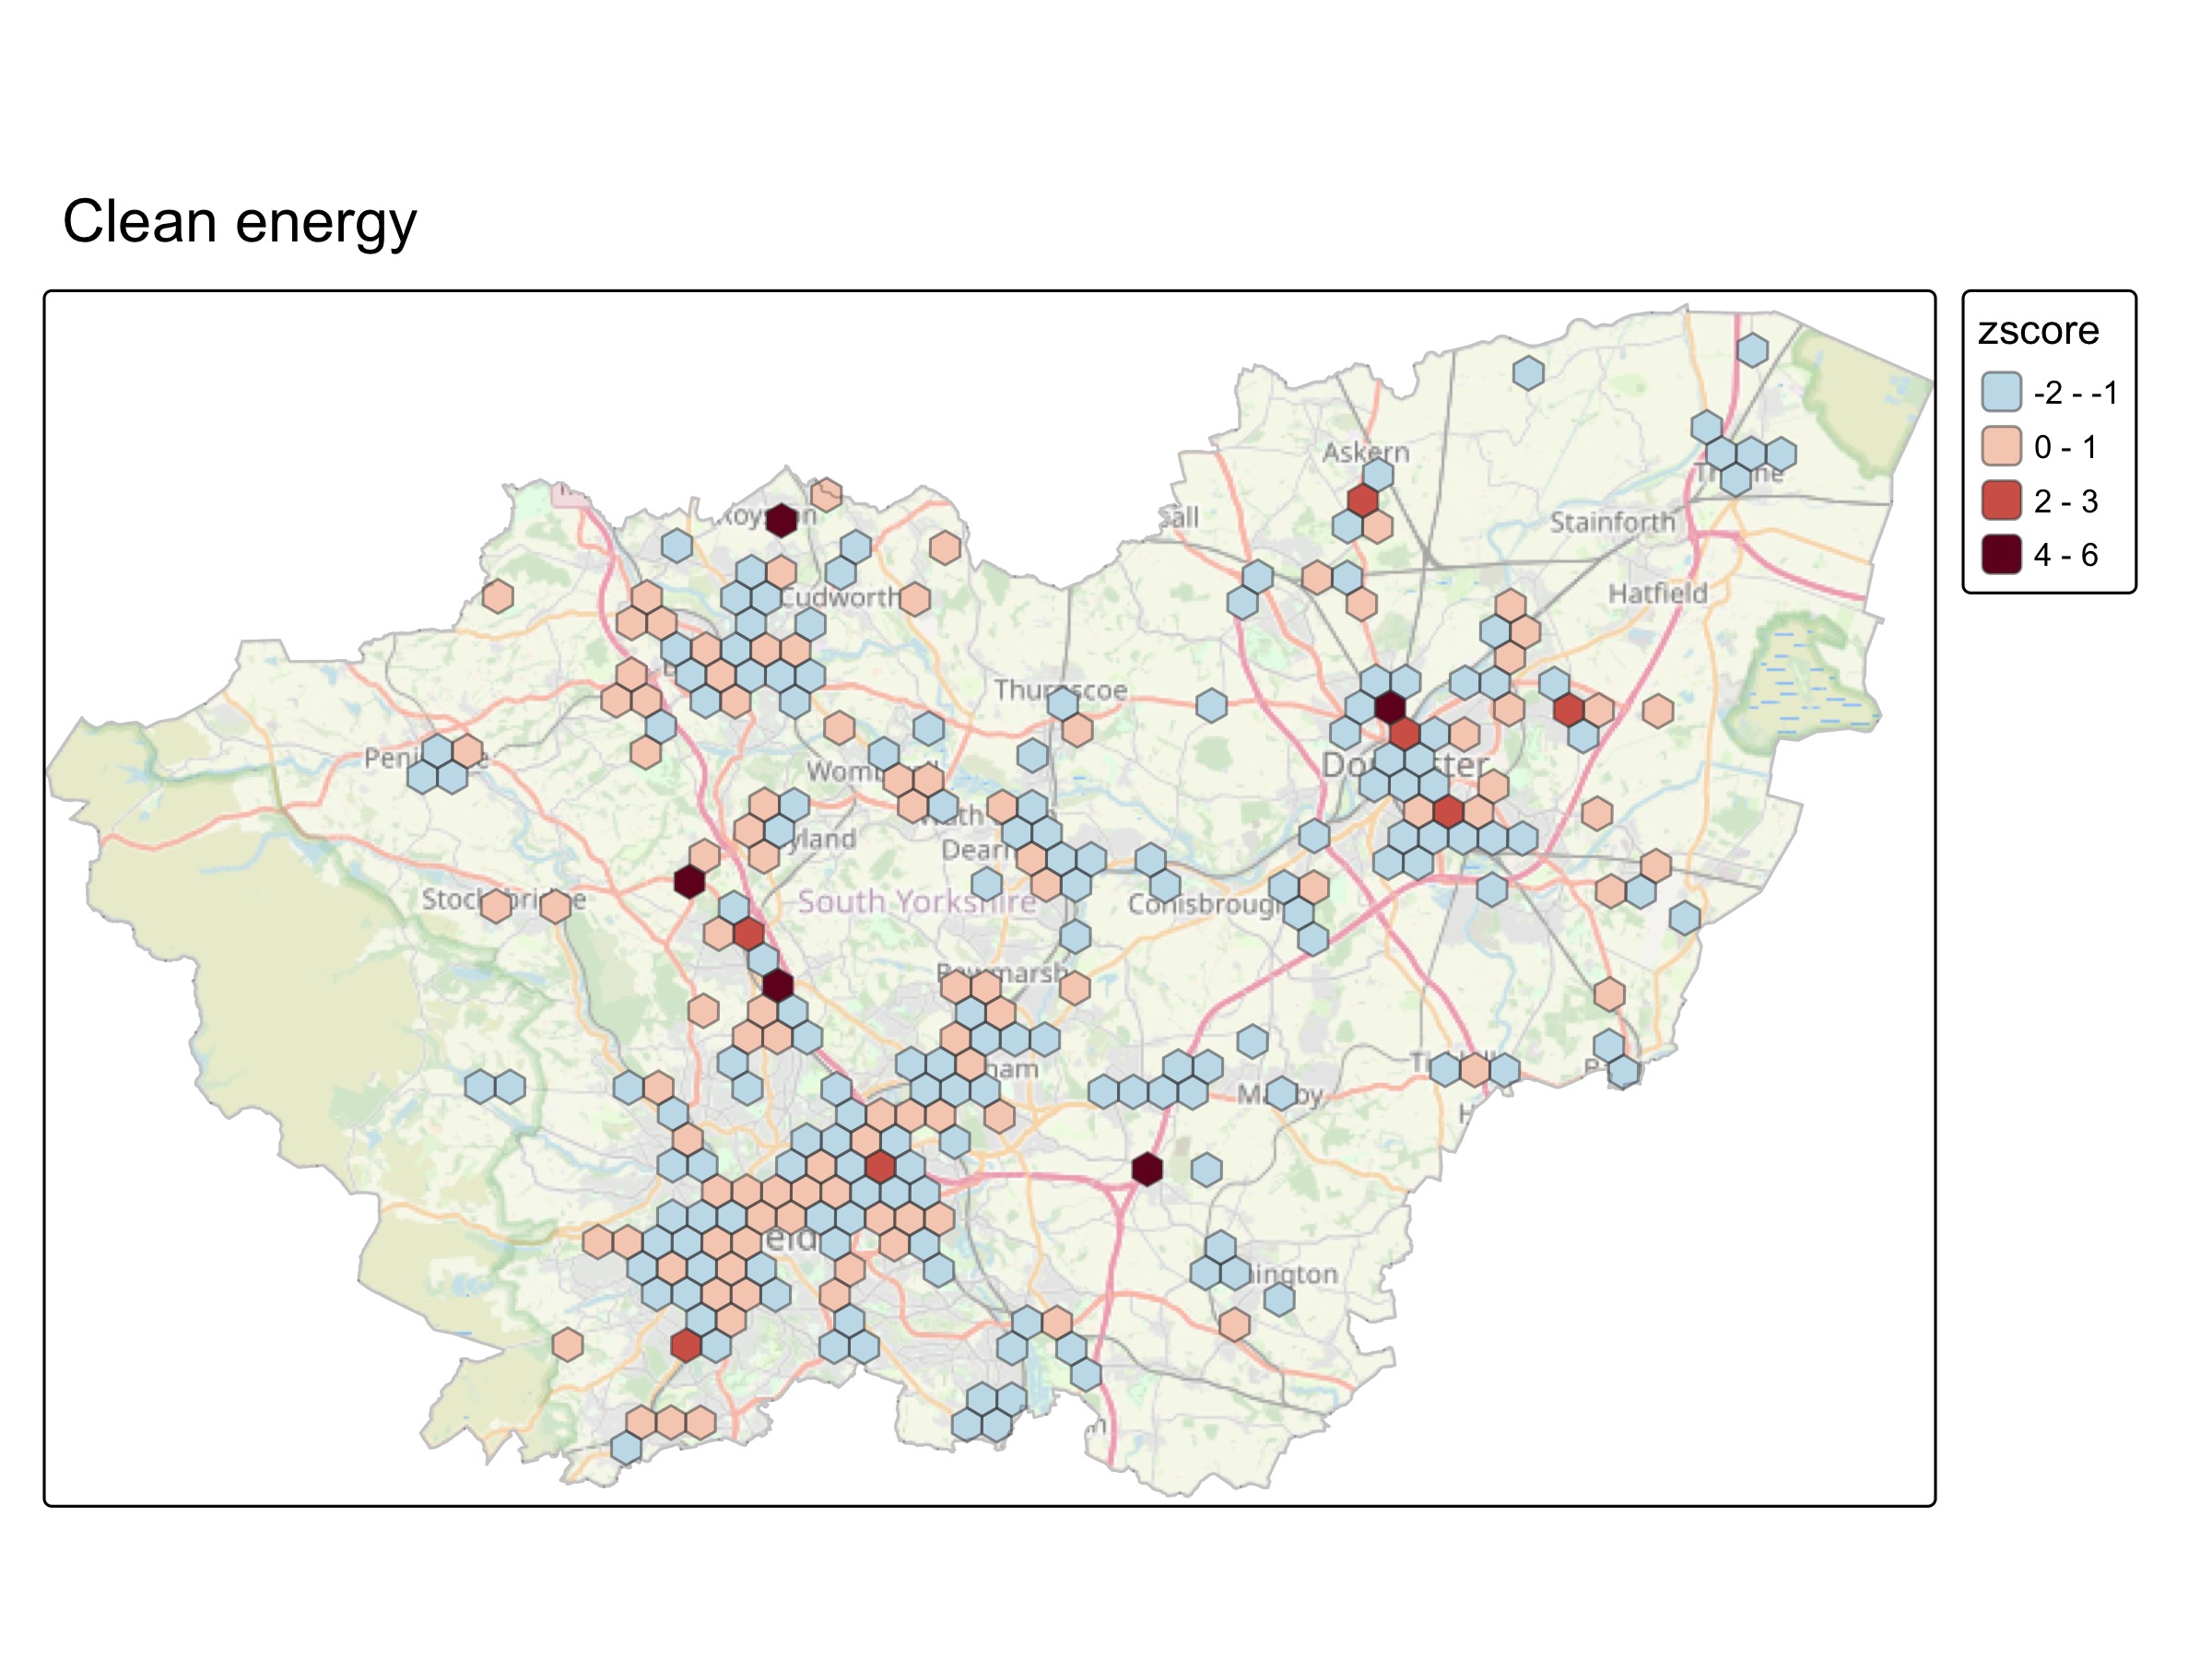
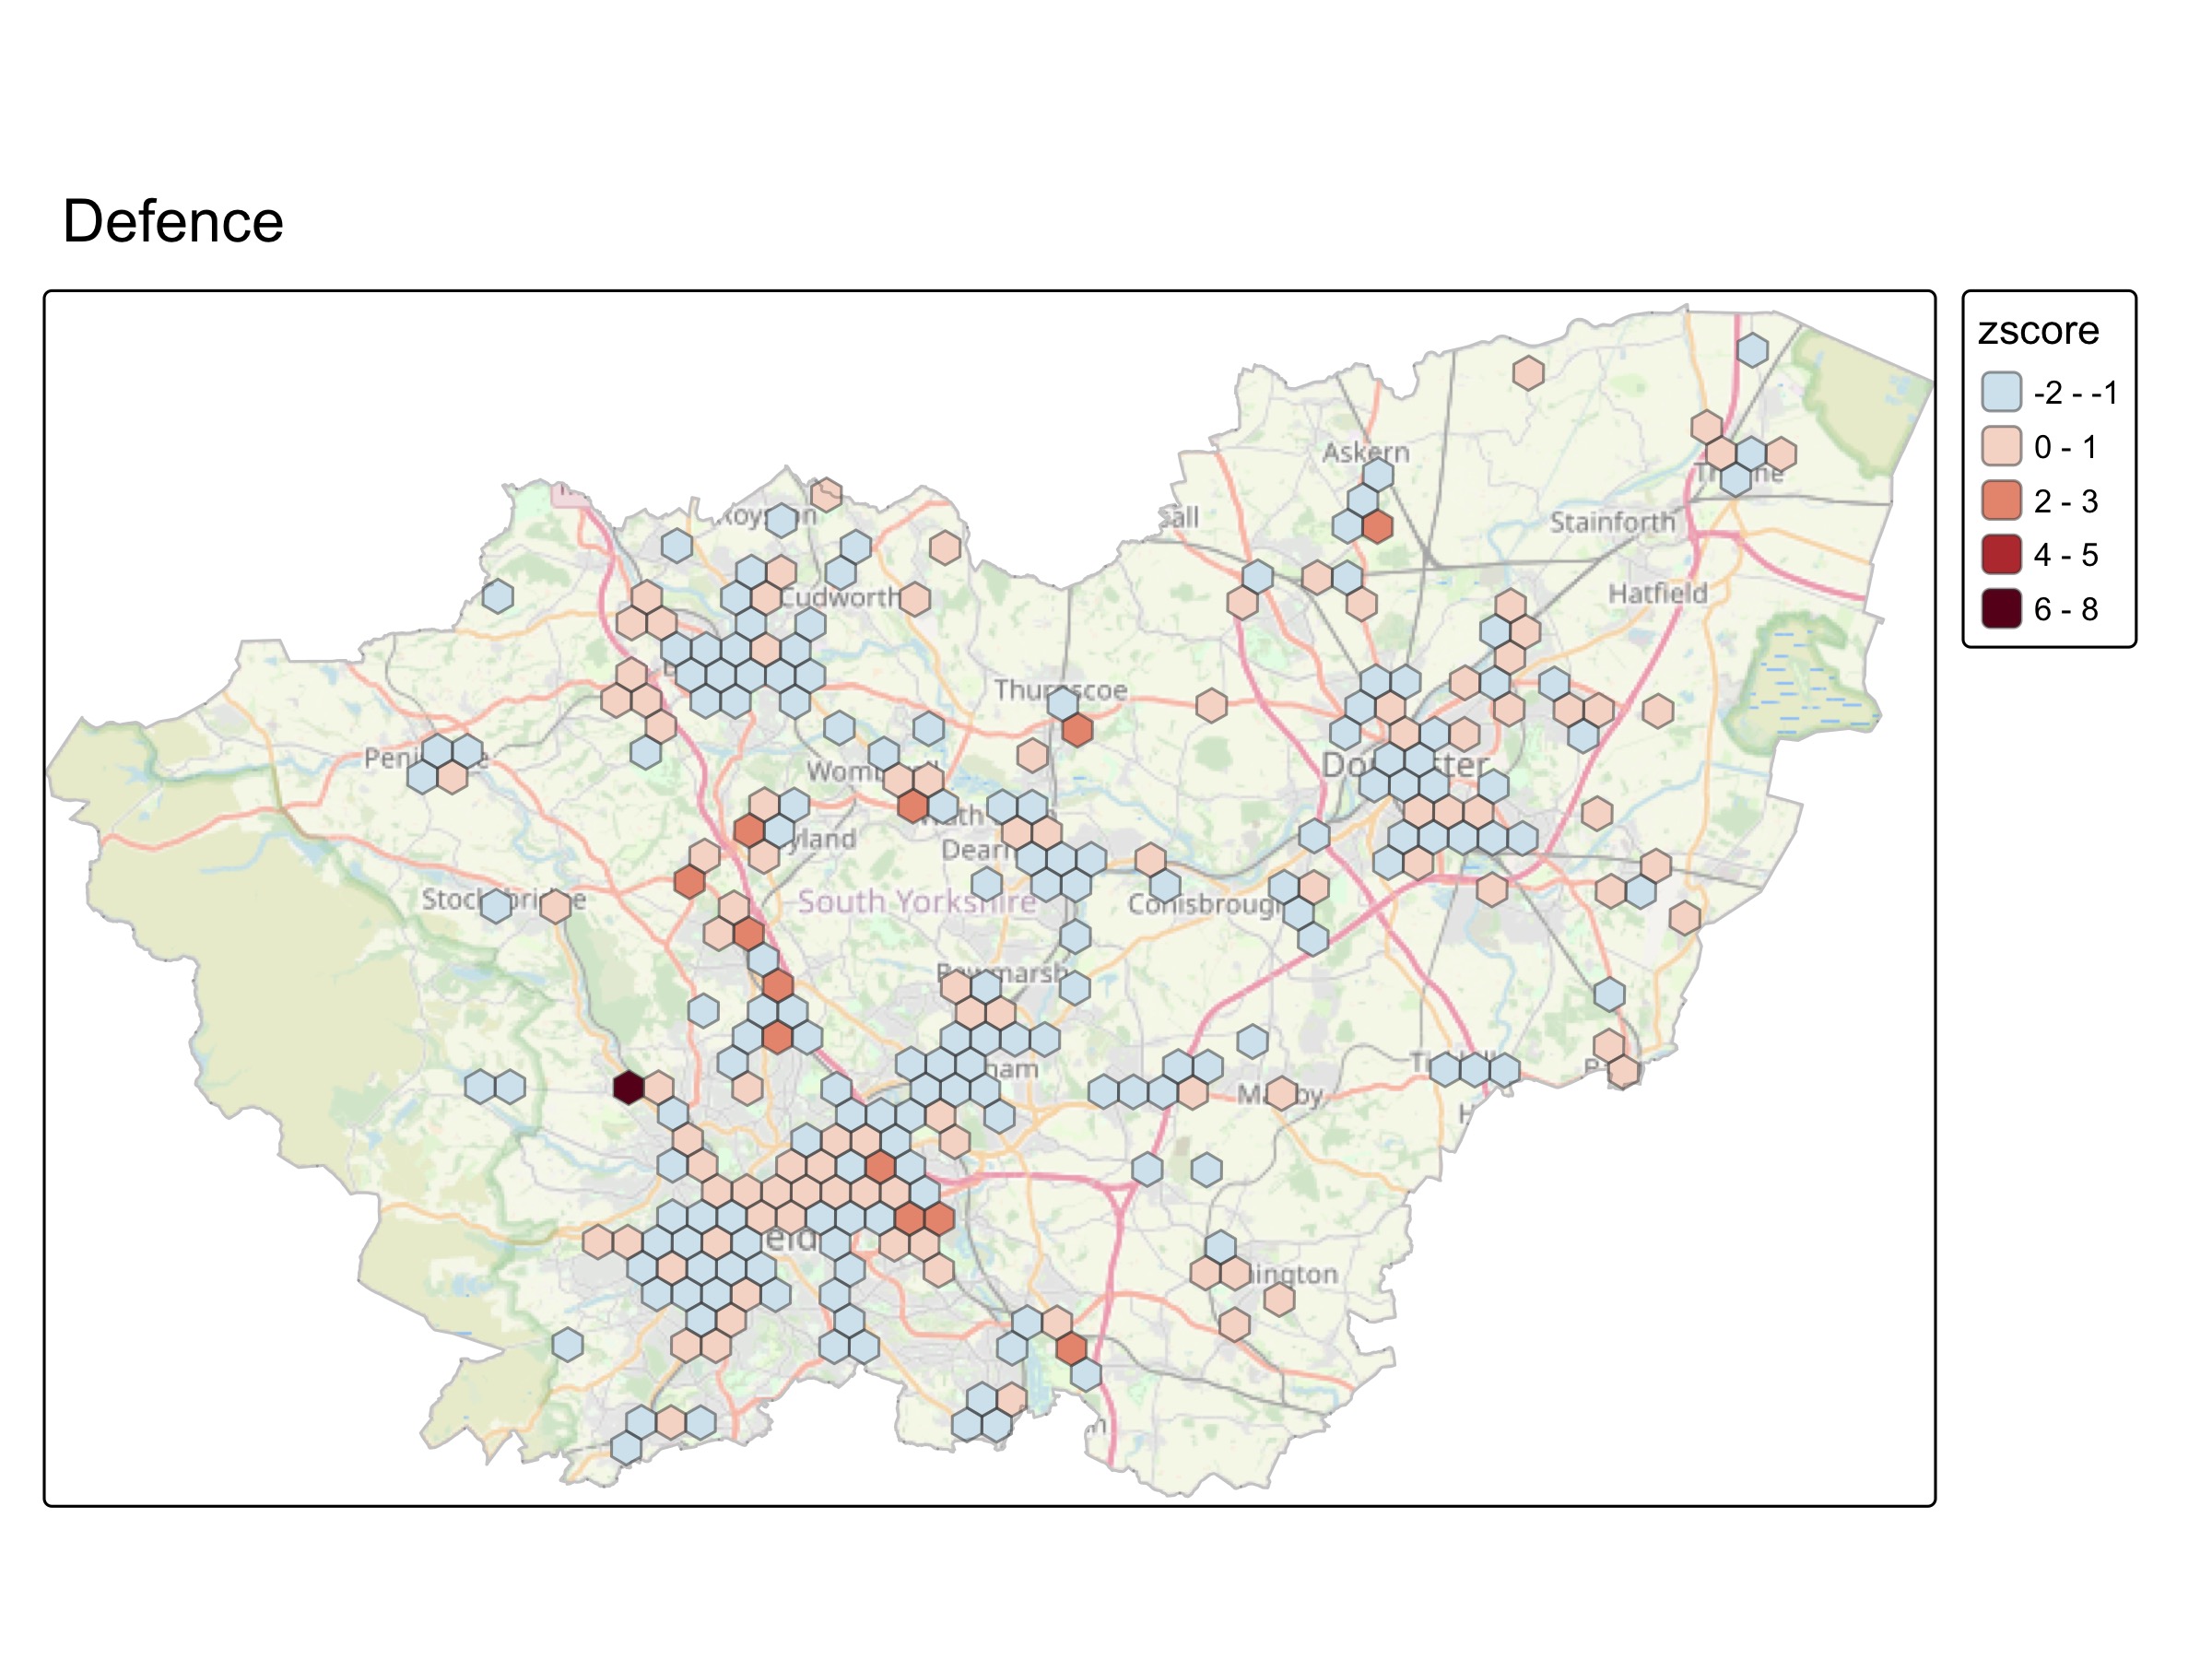
- A series of South Yorkshire maps of four bespoke sectors based on machine learning from companies’ own website text (code). They cover advanced manufacturing, health tech, clean energy and defence.
- Firms with 10+ employees were used. Of those 3661 businesses, 1565 (42.6%) had websites validated against the firm’s postcode - these went into the learning algorithm. See the table below for the numbers on the source data extracted from Companies House accounts.
- Those 3661 firms with 10+ employees are only 11% of total firms, but have 65% of employees. So the firms going into this cluster data cover about 30% of employees in Companies House data for the last year.
- All maps use standardised z-scores for ‘likelihood of belonging to this sector’ for comparability. So e.g. a z-score of 1 or more puts a firm in the top 16% for that sector.
- There are two kinds of map here.
- The z-score for each sector. Each hex shows the average z-score for that zone, weighted by employees per firm.
- Bivariate maps of the same sectors showing the low/medium/high weighted z-score alongside where has relatively low, medium or high employee counts.
- Note, each map uses the same hex zones (1km across) - these are the places in South Yorkshire that have at least 25 employees per hex, for those 1565 businesses.
Combined those two can be useful - e.g. for clean energy, the z-score map shows two hexs north of Doncaster centre; the bivariate map for the same sector shows a zone with a high z-score, but relatively low employment
Four sector maps
Sector score vs employee count maps