
Spatial R for social good!
Well maybe. Sheffield R User Group kindly invited me to wiffle at them about an R topic of my choosing. So I chose two. As well as taking the chance to share my pain in coding the analysis for this windfarms project, I thought I’d bounce up and down about how great R’s spatial stuff is for anyone who hasn’t used it. It’s borderline magical.
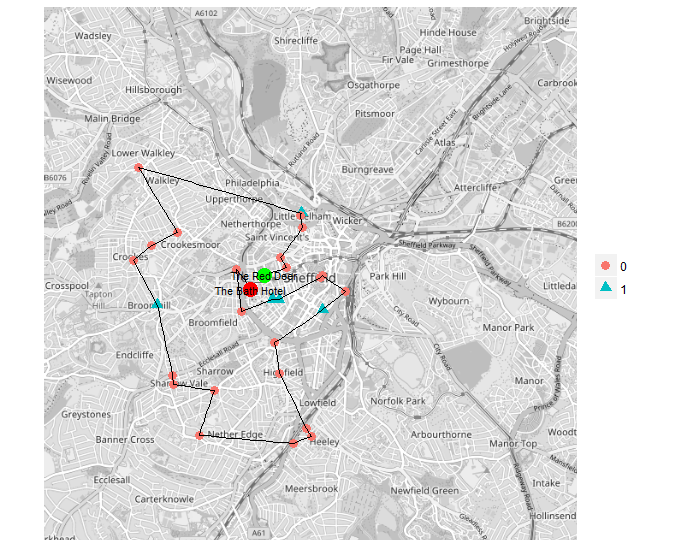
So by way of introduction to spatial R, and to honour the R User Group’s venue of choice, I present the Pub Crawl Optimiser.
I’ve covered everything that it does in the code comments, along with links. But just to explain, there were a few things I wanted to get across. (A lot of this is done better and in more depth at my go-to intro to spatial R by Robin Lovelace and James Cheshire.) The following points have matching sections in the pubCrawlOptimiser.R code.
-
The essentials of spatial datasets: (in ‘subset pubs’) - how to load or make them from points and polygons, how to use one to easily subset the other using R’s existing dataframe syntax. How to set coordinate reference systems and project something to a different one, so everything’s in the same CRS and will happily work together. (The Travel to Work Area shapefile is included in the project data folder.)
-
Working with JSON and querying services: a couple of examples of loading and processing JSON data using the jsonlite package, including asking google to tell us the time it takes between pubs - accounting for hilliness. This is very important in Sheffield if one wants to move optimally between pubs. Pub data is downloaded separately from OpenStreetMap but we query OSM directly to work out the centroids of pubs supplied as ways.
-
A little spatial analysis task using the TSP package to find shortest paths between our list of pubs - both for asymmetric matrices with different times depending on direction, and symmetric ones just using distance.
-
Plotting the results using ggmap to get a live OSM map for Sheffield. Note how easy it is to just drop TSP’s integer output into geom_path’s data to plot the route of the optimal pub crawl.
-
There’s also a separate script looking at creating a spatial weights matrix to examine spatial dependence. These are easy to create and do very handy jobs with little effort - e.g. if we want to know what the average number of real ale pubs per head of population in neighbouring zones, it’s just the weights matrix multiplied by our vector of zones.
The very first part of code that’s processing pub data downloaded from OSM - couple of things to note:
- Just follow the overpass turbo link via the pub tag wiki page.
- I remove the relations line ( relation[“amenity”=”pub”](); ) just to keep nodes and ways.
- Once you’ve selected an area and downloaded the raw JSON, the R code runs through it to create a dataframe of pubs, keeping only those with names. It also runs through any that are ways (shapes describing the pub building), finds their points and averages them as a rough approximation of those pubs’ point location. I could have selected a smaller subset of data right here, of course, but wanted to show a typical spatial subsetting task.
A couple of friends have actually suggested attempting the 29 pub crawl in the code (below, starting at the Red Deer and ending at the Bath Hotel). I am not sure that would be wise.
So what would you want to see in an essential introduction to spatial R for anyone new to it?