| Kind of sector | GVA per hour | Capital per hour | Pay, share of GVA | Excess, share of GVA |
|---|---|---|---|---|
| High physical capital | £126 | £547 | 33% | 38% |
| Intangible-heavy | £63 | £32 | 64% | 24% |
| Mixed | £31 | £118 | 75% | −9% |
| Low physical capital | £25 | £23 | 74% | 12% |
What GVA per hour is made of
Q3: pay, taxes, depreciation, a return on capital and the excess, sector by sector
In short (UK, current prices, per hour worked by all workers):
- Pay explains little of the gap between sectors. Across the 13 sectors, pay per hour varies 4.2-fold in 2023 but GVA per hour 13.0-fold. Of that spread, pay accounts for 10% (17% in 2024) and the excess for 67% (59%).
- Where the money goes depends on the kind of sector. Capital-heavy sectors produce £126 of GVA an hour with £547 of capital per hour; pay is 33% of their GVA. Low-capital sectors produce £25 an hour, and pay is 74%.
- The excess is concentrated and volatile: £190 an hour in electricity and gas in 2023, the energy-price windfall, and £86 in 2024.
- The choices matter in particular cells, not everywhere. The required return on capital moves only capital-heavy sectors. The labour share of mixed income moves real estate. The treatment of dwellings decides real estate’s sign. Which sectors have the largest excess survives every setting.
- In growth, sector differences are mostly MFP, the residual. Capital intensity doesn’t predict capital deepening.
- This is accounting, not causation. Set the required return to a sector’s actual return and its excess is zero by construction (Felipe & McCombie). The split shows who receives GVA per hour, not why it differs.
The question is the plan’s Q3: how much do factors other than labour matter, in very different sectors? This page draws on A2’s decomposition (the factors note, 2026-11-04) and R3’s data survey (the factor-data note). It lays out the implications of each assumption rather than choosing one (decision 13).
1 The split
For one sector in one year, per hour worked (H):
\[ \frac{\text{GVA}}{H} = \underbrace{\frac{\text{CoE} + \alpha\,\text{MI}}{H}}_{\text{pay}} + \underbrace{\frac{T}{H}}_{\text{taxes}} + \underbrace{\frac{\text{CFC}}{H}}_{\text{depreciation}} + \underbrace{r^{*}\frac{K}{H}}_{\text{required return}} + \underbrace{\frac{\text{excess}}{H}}_{\text{the rest}} \]
- CoE is compensation of employees; MI is mixed income, the self-employed’s surplus, of which a share α counts as their pay.
- T is taxes less subsidies on production (business rates, not VAT); CFC is consumption of fixed capital.
- K is the net capital stock at current replacement cost, and r* the required real return on it.
- The excess is whatever is left: (actual net return − r*) × K. It’s land and resource rent, market power, risk, mismeasured capital, and the return to intangibles the accounts don’t count, all at once.
Data: income from the Blue Book 2026 supply and use tables (103 industries); capital stocks and depreciation from ONS’s 2025 edition (37 industries), split to finer sectors with ONS’s VICS productive-stock shares; hours from ONS output per hour by division (UK, all workers, old LFS basis, August 2026). The vintages don’t line up until 2027, so every figure says which it uses. Script: claude_research/productivity/R/a2_03_levels.R, with downloads in claude_research/productivity/R/a2_01_fetch.R and inputs in claude_research/productivity/R/a2_02_inputs.R.
2 By sector
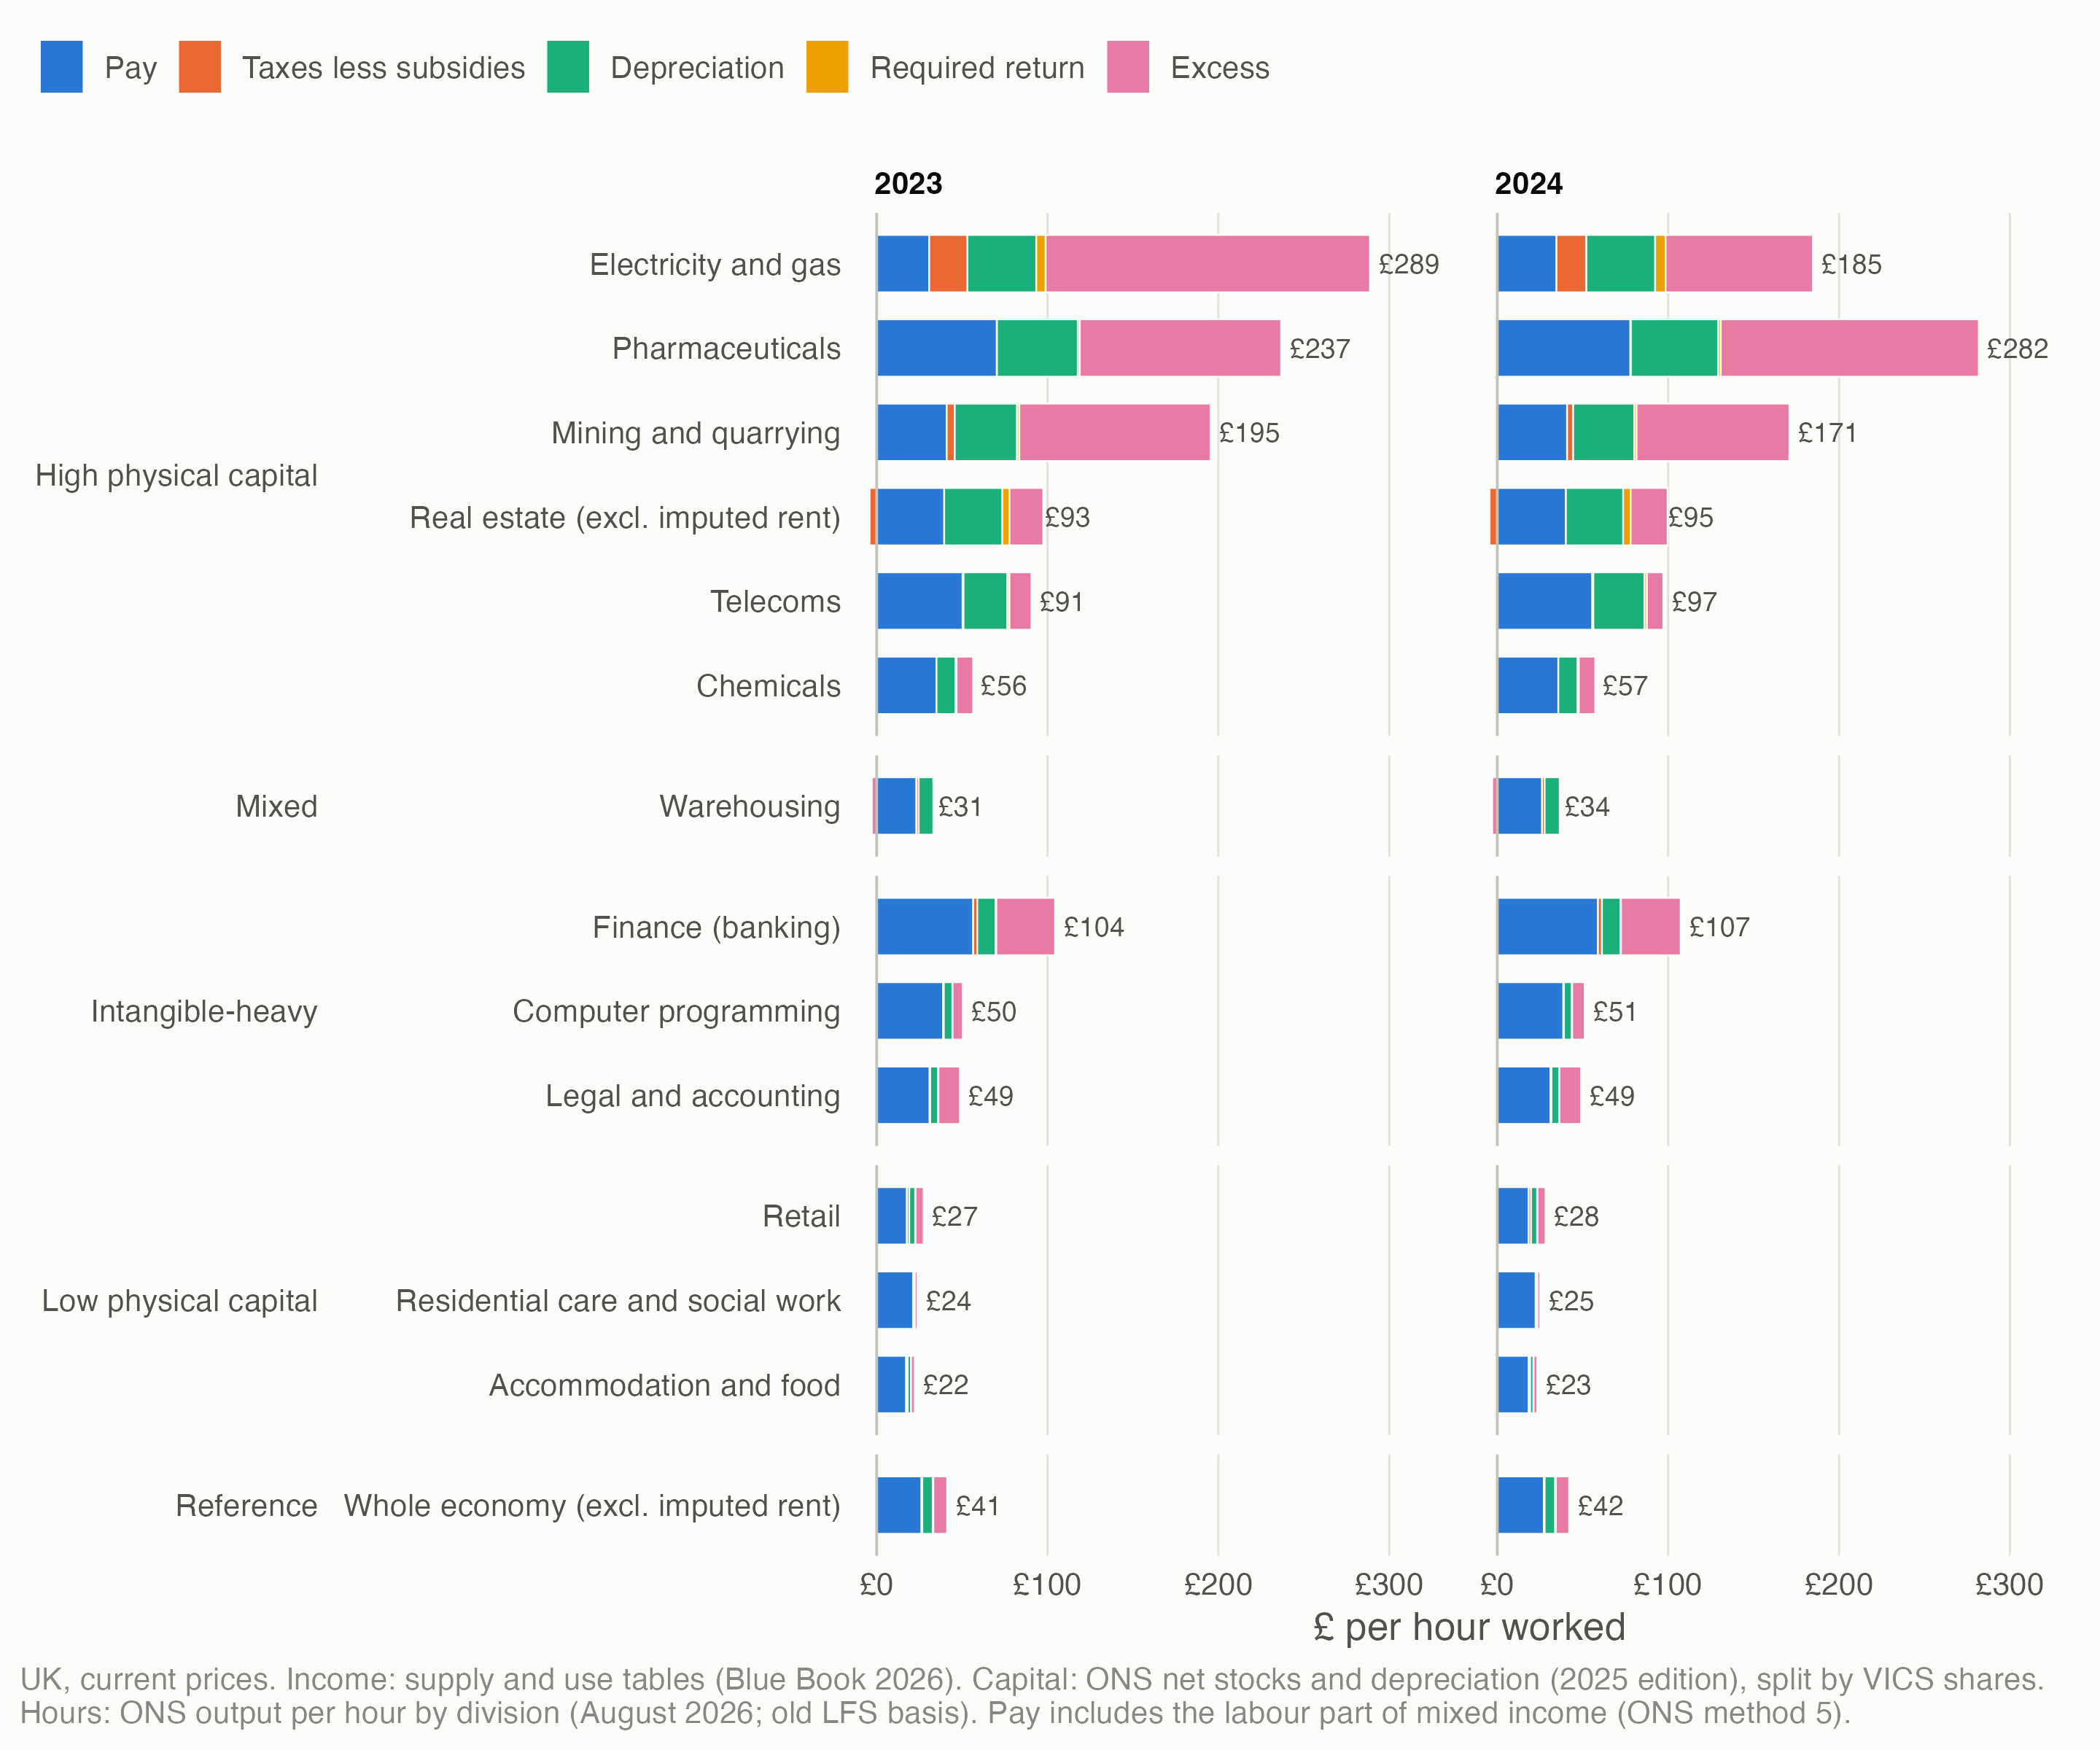
- The excess is concentrated. In 2023 it’s £190 an hour in electricity and gas, £118 in pharmaceuticals, £112 in mining (mostly resource rent) and £34 in finance, against £4.7 in retail and £1.5 in care. Warehousing’s is negative: its actual net return was −1.8%.
- 2023 or 2024? 2023 has every check, but it’s the energy-windfall year. Electricity and gas’s excess fell from £190 to £86 an hour in 2024, and pay’s share of the spread across sectors rose from 10% to 17%. Both years are shown throughout; neither is the headline.
3 The choices, and what each changes
Six assumptions decide the split. A2 ran every sector under each setting, holding the others at their defaults:
| Switch | Default | Alternatives run |
|---|---|---|
| r*, the required real return | The real 10-year gilt yield from index-linked gilts (0.57% in 2023) | ONS’s natural-capital construction (the nominal yield deflated by GDP-deflator inflation: −2.09% in 2023); Ofgem’s allowed return (energy only); 5%; 10%; each sector’s actual return |
| α, the labour part of mixed income | ONS’s “method 5”: the industry’s employee share of CoE + GOS | 0, 0.66, 1; or the self-employed paid like the sector’s employees |
| Capital split to finer sectors | VICS productive-stock shares | EU KLEMS net-stock shares; equal capital per hour within the group |
| Real estate’s dwellings | Keep the tenants’ share of all rent (26.6% in 2023), to match GVA without imputed rent | All dwellings; none |
| Intangibles | Not capitalised (the national accounts’ boundary) | Capitalised, with EU KLEMS ratios to GVA |
| Mixed-income year | 2019 shares | 2021 |
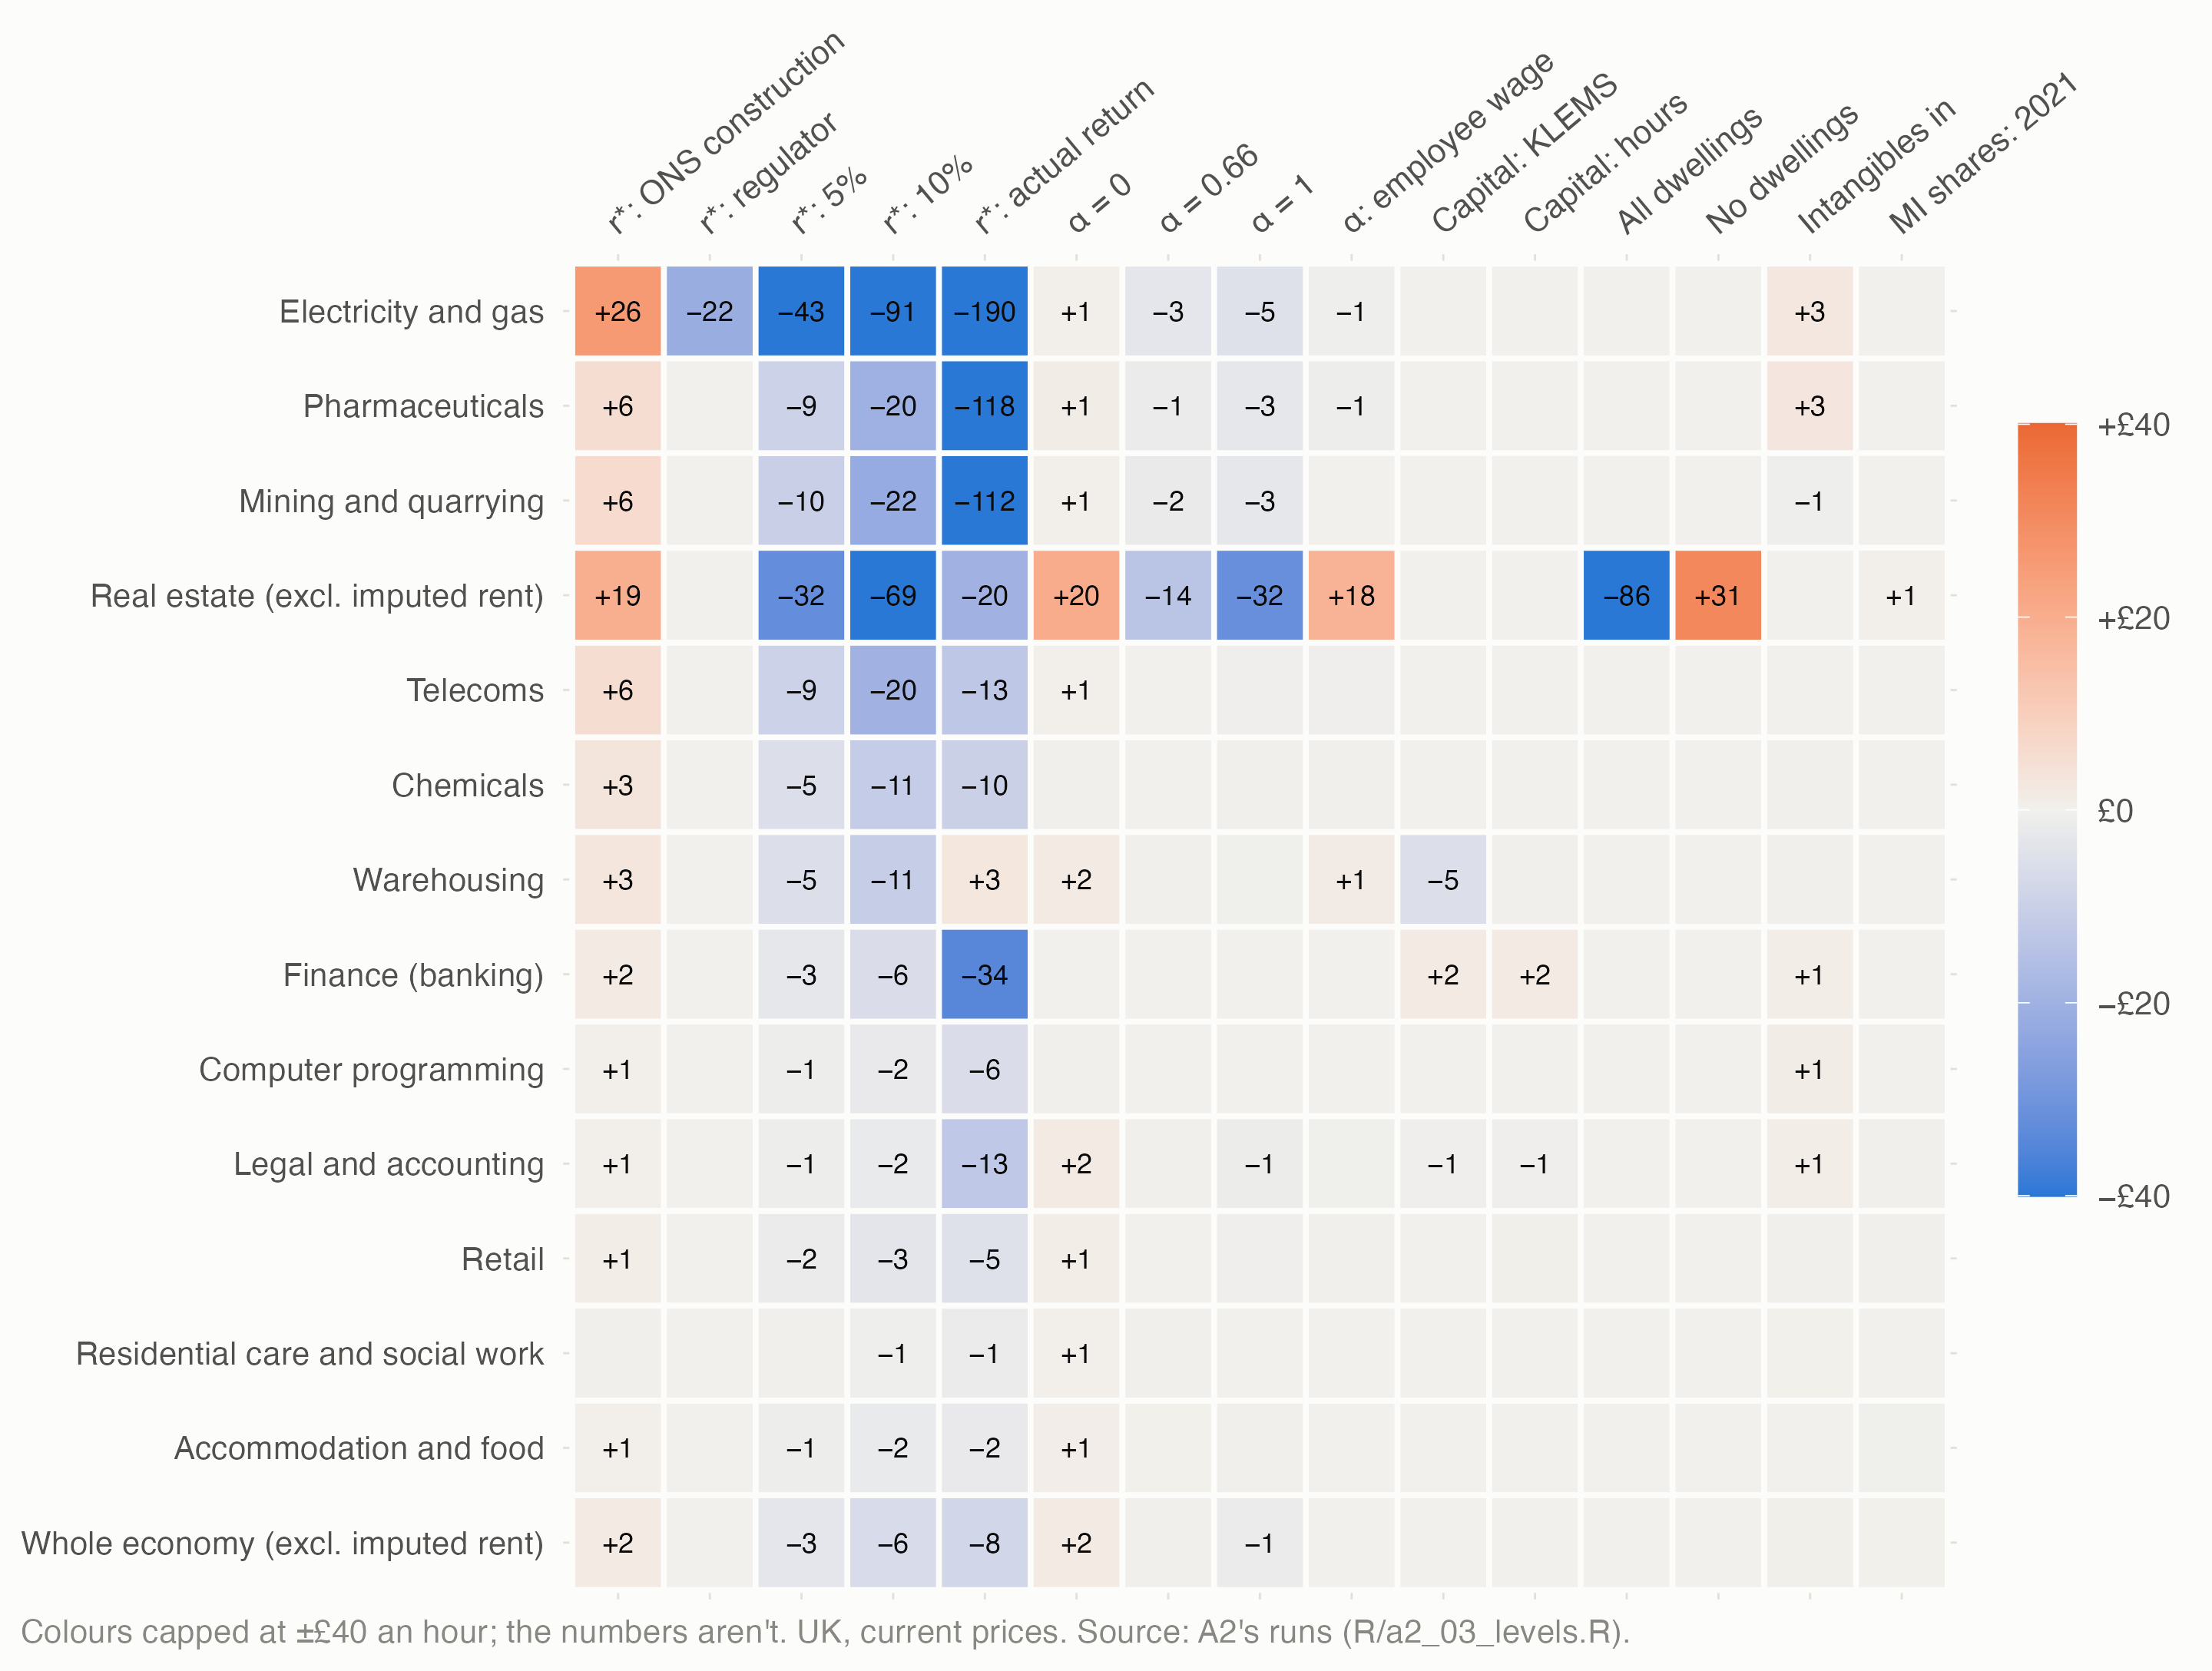
What depends on what:
- r* matters only where capital is heavy. The required return is r* × capital per hour, so it moves real estate, electricity and gas, and warehousing, and barely touches programming, legal services or care (Figure 3).
- α decides real estate. Most of real estate’s surplus, outside imputed rent, is landlords’ mixed income, but few landlords show up in the hours. Counting it as labour or as surplus moves the cell by tens of pounds an hour.
- The dwellings choice decides real estate’s sign. Across every setting run, real estate’s excess runs from −£66 to £51 an hour.
- Capitalising intangibles raises GVA and capital per hour in programming, finance and legal services, but moves their excess by only a few pounds an hour.
What survives every setting (2023; every setting except “each sector’s actual return”, which zeroes every excess):
- Electricity and gas, mining and quarrying and pharmaceuticals are in the top three by excess per hour under every setting.
- The ordering of sectors by excess per hour correlates at least 0.63 with the default ordering under any single change (rank correlation).
- Retail, accommodation and food, and care never have an excess above £6 an hour.
- Pay’s share of the spread in GVA per hour stays small: 10% at any r*, since r* moves only the capital parts. The excess’s share falls from 67% at the default to 45% at r* = 10%.
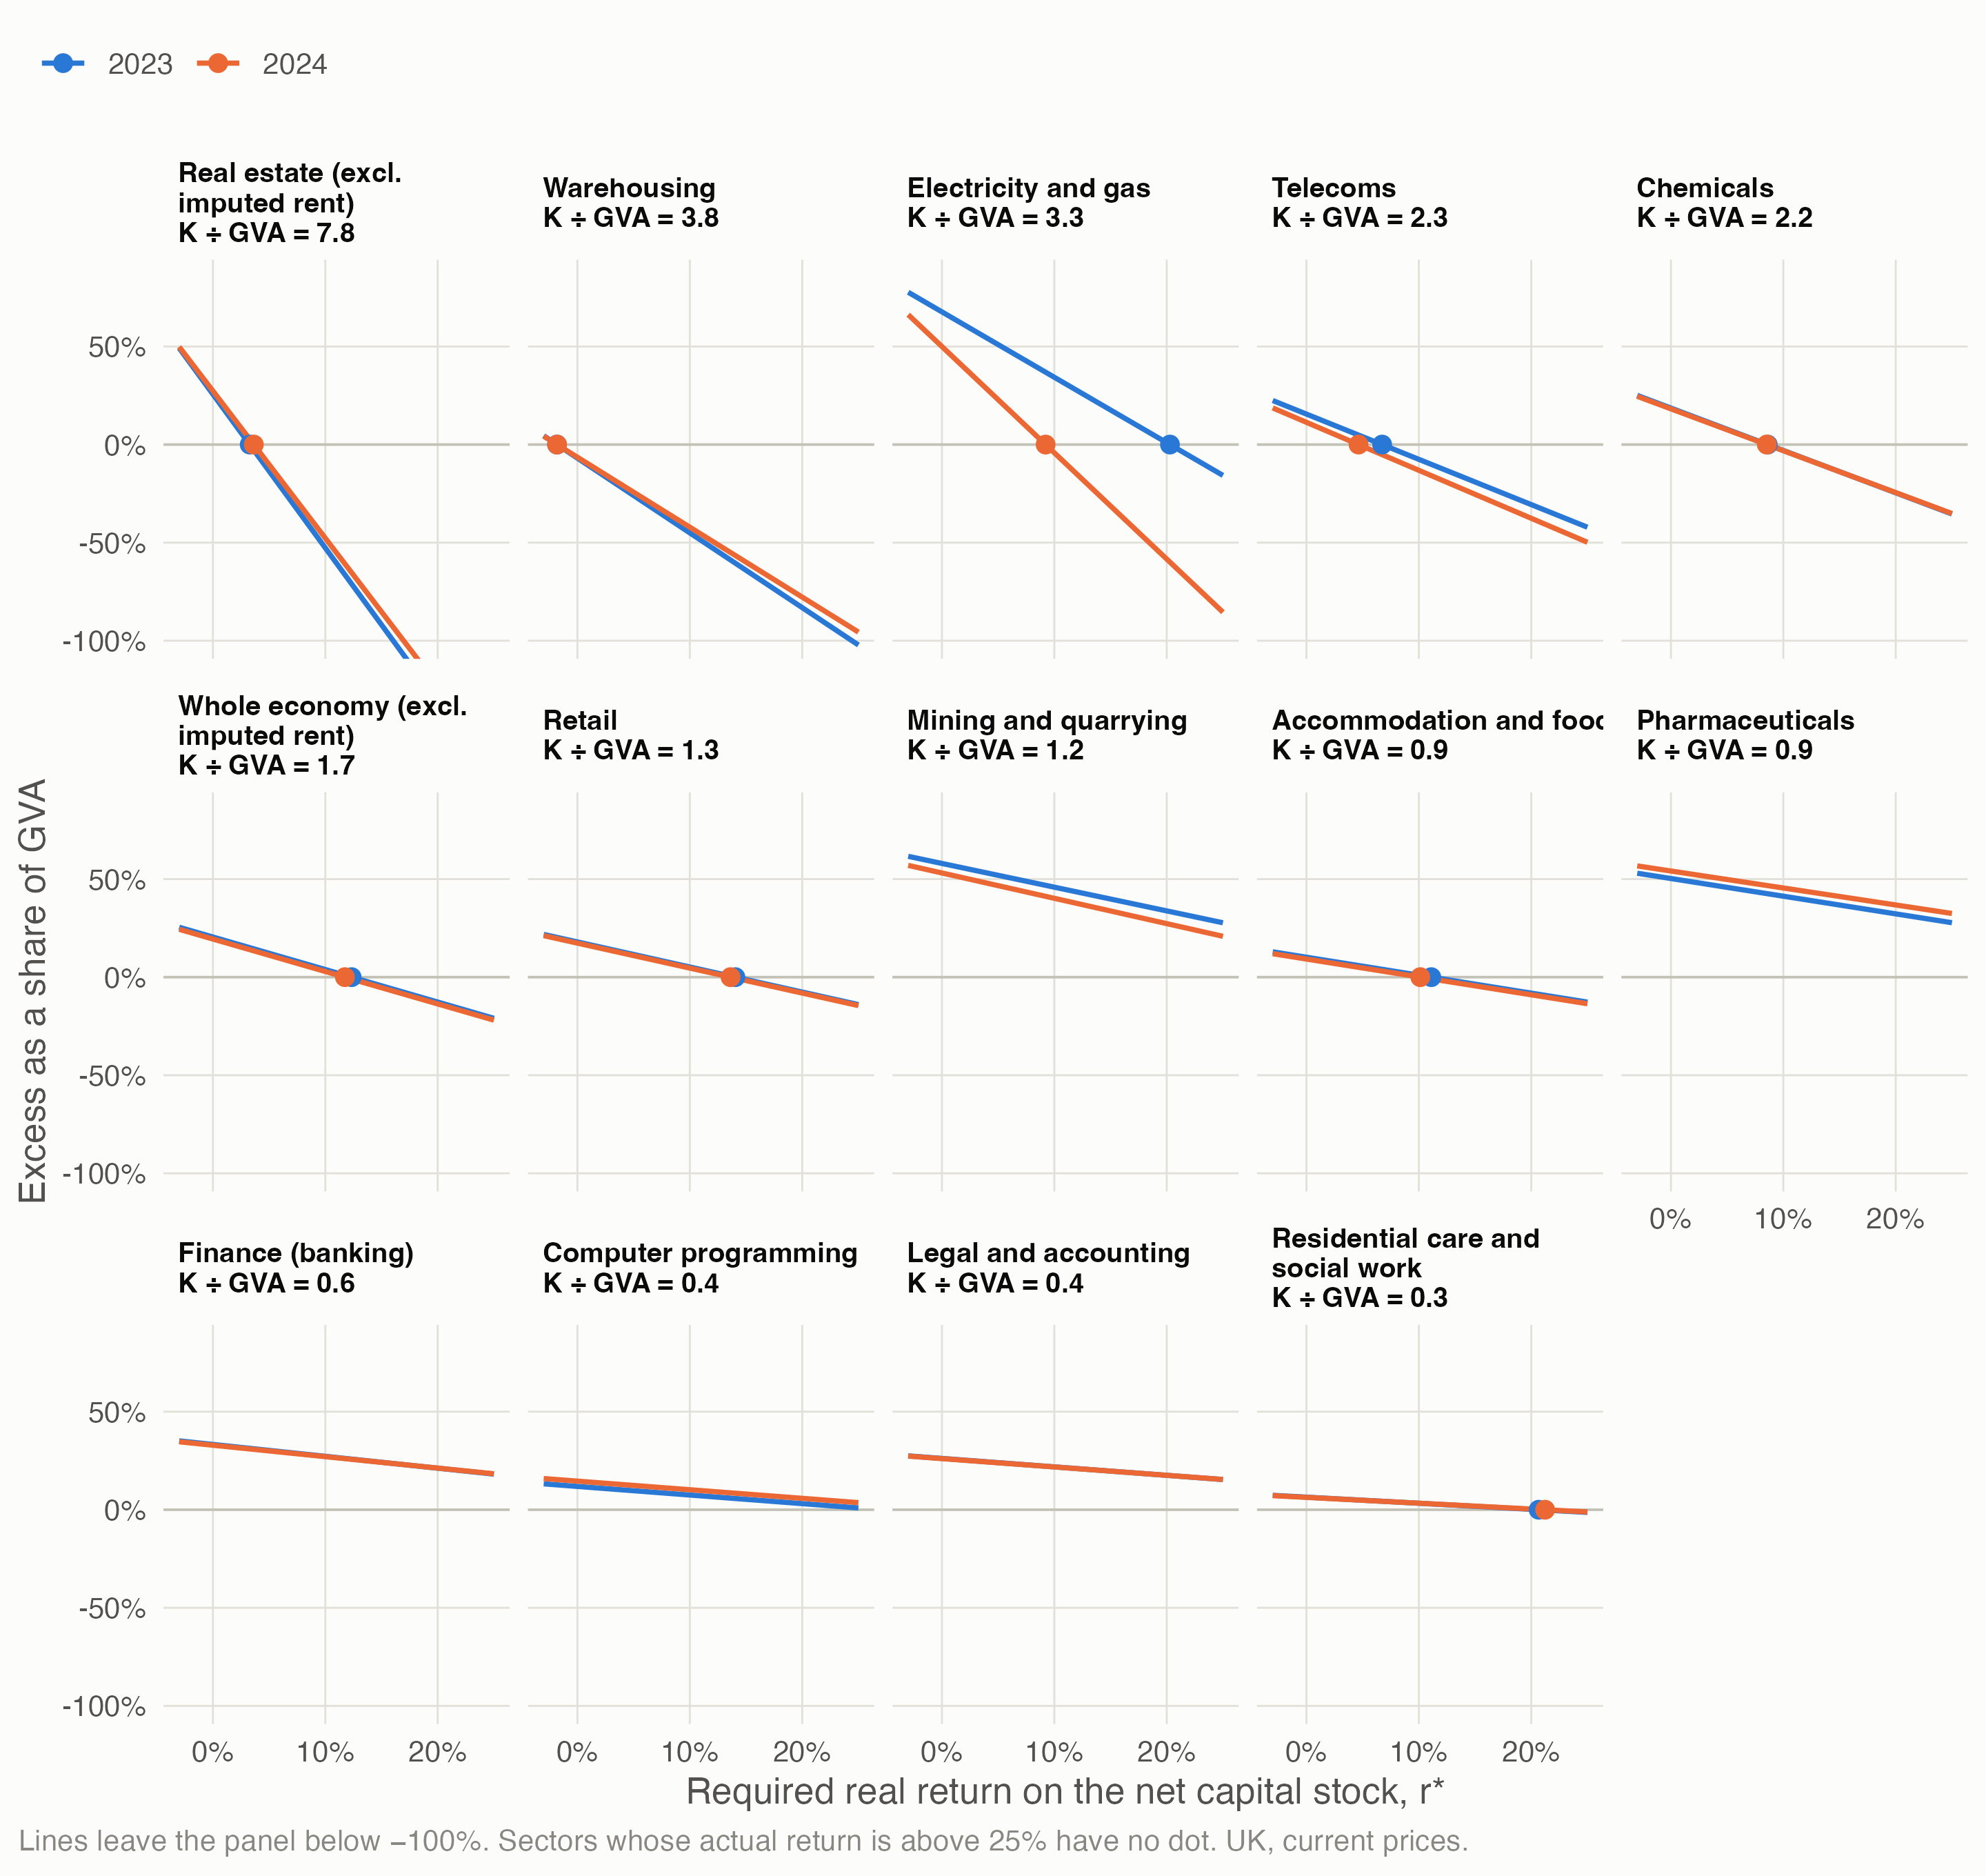
Each sector’s actual net return in 2023, where its excess would be zero: warehousing −2%; real estate (excl. imputed rent) 3%; telecoms 7%; chemicals 9%; accommodation and food 11%; retail 14%; electricity and gas 20%; residential care and social work 21%; computer programming 27%; mining and quarrying 48%; finance (banking) 55%; pharmaceuticals 56%; legal and accounting 61%. For comparison, ONS’s implied real return for the whole market sector (VICS) is 22.6% in 2023.
Why the default r* isn’t ONS’s construction. ONS’s natural capital accounts deflate the nominal 10-year gilt yield by GDP-deflator inflation. That swings with inflation after the event, and was negative in 2020–23, which adds to the excess and is hard to read. The market’s own real yield, from index-linked gilts, is positive in both years. In 2024 the two are close. Index-linked gilts pay RPI inflation, which has generally run above CPI, so this yield is lower than a CPI-based one would be.
4 Growth: capital, labour and MFP
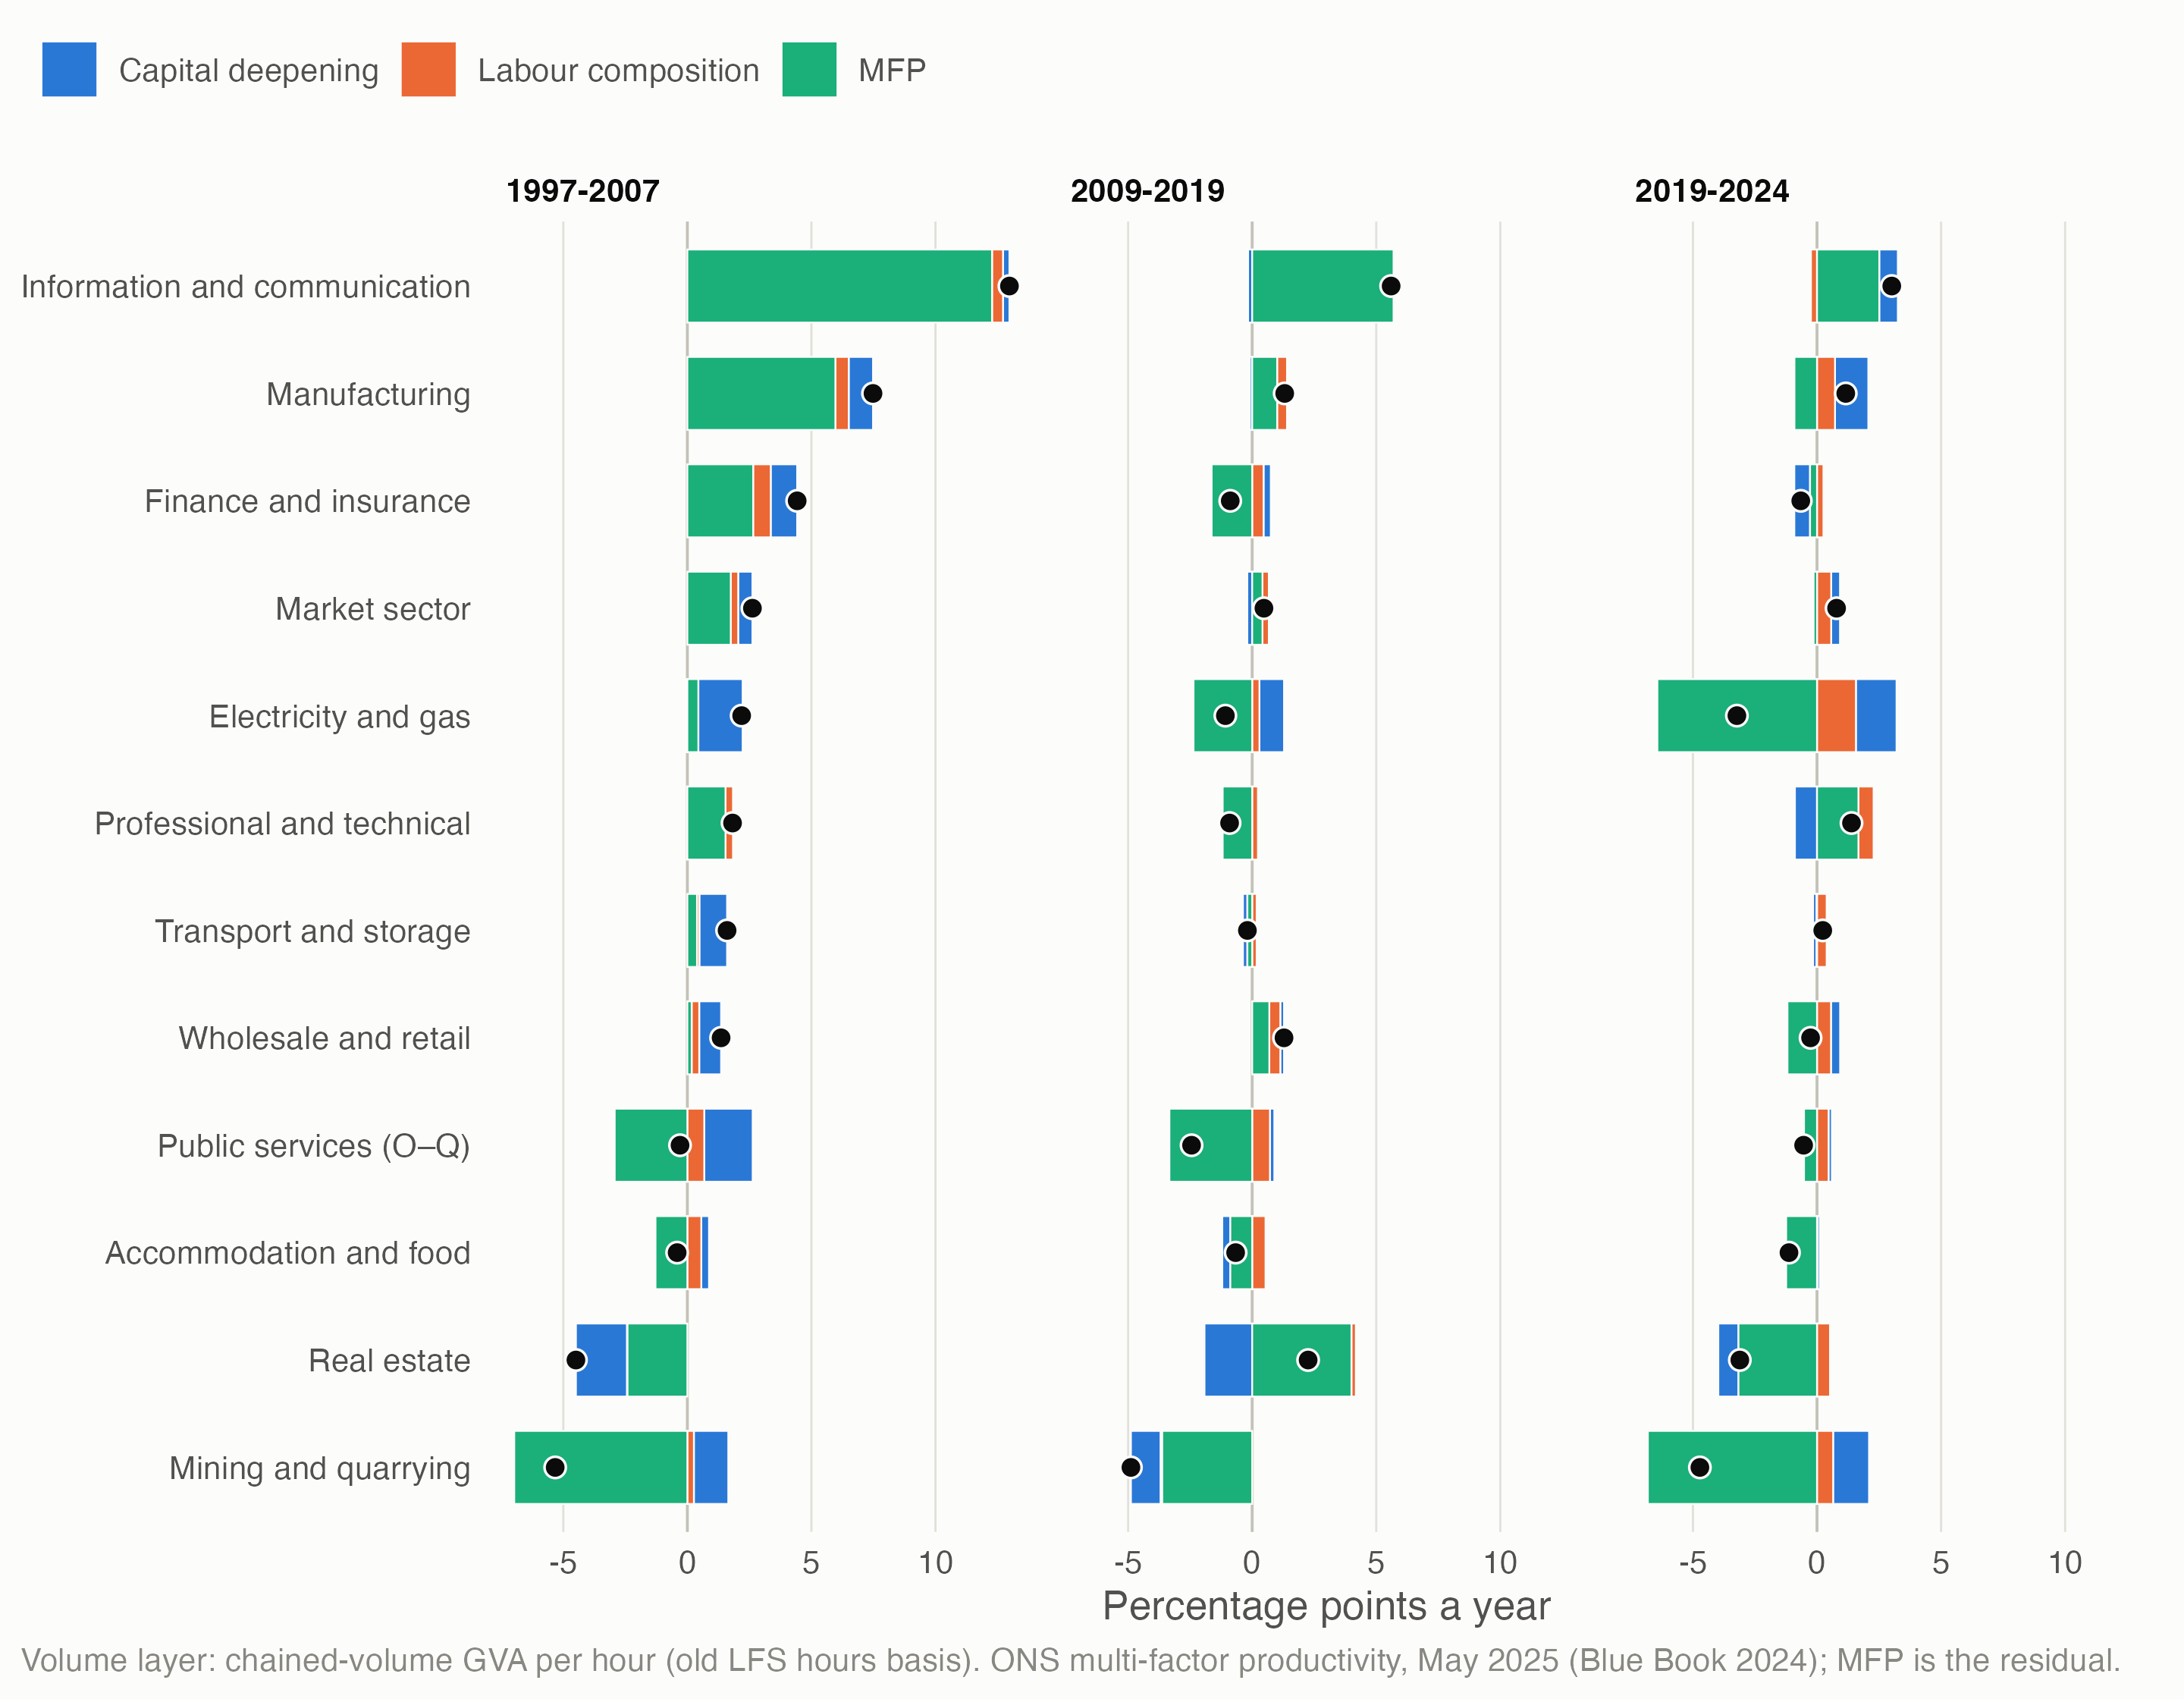
- MFP carries most of the differences between sectors: across ONS’s 16 market-sector groups it accounts for over 90% of the spread in output-per-hour growth in 1997–2007 and 2009–2019; capital deepening for under a tenth.
- Capital-heavy sectors don’t grow through capital deepening. Across the sections that hold the sector set, capital per hour (in levels) is unrelated to capital deepening’s contribution to growth.
- MFP is a residual, and in places it’s measurement. Mining’s strongly negative MFP is the North Sea running down: natural capital isn’t an input in growth accounting. Telecoms’ very high MFP in EU KLEMS reflects its double-deflated price index, the subject of the stuff-vs-money model. In growth, MFP plays the role the excess plays in levels: everything the measured inputs don’t account for.
Script: claude_research/productivity/R/a2_04_growth.R. EU KLEMS & INTANProd (2024 release) carries finer industries to 2020; see the factors note §6.
5 Special cells
- Real estate (excluding imputed rent). 97% of the industry’s capital is dwellings, but GVA leaves out owner-occupiers’ imputed rent. The default keeps dwellings in proportion to tenants’ share of household rent spending (26.6% in 2023). Land isn’t in the capital stock, so land rent sits in the excess.
- Non-market producers have operating surplus equal to depreciation by convention, so their excess is −r* × K by construction. Residential care and social work is partly non-market.
- Mining has no subsoil assets in its capital stock, so its excess is mostly resource rent: £13.3bn in 2023.
- Finance’s GVA includes FISIM, an imputed interest margin that carries a risk premium; part of its excess is that margin.
- Electricity and gas. Blue Book 2026 raised its 2023 GVA by 44% against the hours file’s vintage, and the energy-price shock runs through its operating surplus.
6 Open questions
- Mining’s excess is 2.5 times ONS’s own oil and gas resource rent for 2023. ONS builds its figure from North Sea Transition Authority data and spreads decommissioning costs; which difference matters most is unchecked.
- ONS’s mining capital stock (£28bn in 2023) is far below EU KLEMS’s (£139bn in 2021). Revision or method?
- Real estate: do rented and owner-occupied homes have similar rent-to-value ratios? Social rents suggest the tenure share understates rented homes’ value. And what are the negative, growing subsidies on production in real estate?
- Legal and accounting: partners in limited liability partnerships aren’t employees, so their profit shares may count as surplus rather than pay. How the national accounts treat them is unchecked.
- Electricity’s production taxes jumped from 2022: is the Electricity Generator Levy recorded there?
- Vintages: capital stocks on the Blue Book 2026 basis (December 2026) and ONS’s next growth accounts would bring the inputs into line.
- Physical units and regions. The physical case studies (tonnes, MWh) and carrying the split down to regions are still to do.
Data and code. A2’s scripts: claude_research/productivity/R/a2_01_fetch.R, claude_research/productivity/R/a2_02_inputs.R, claude_research/productivity/R/a2_03_levels.R (the engine; switches at the top), claude_research/productivity/R/a2_04_growth.R, claude_research/productivity/R/a2_05_figures.R. Sources: ONS supply and use tables, Blue Book 2026 (30 October 2026); ONS capital stocks (27 November 2025); ONS VICS (23 May 2025); ONS output per hour by division (18 August 2026); ONS ad hoc 14824 (mixed income); Bank of England gilt yields (downloaded 4 November 2026); ONS multi-factor productivity (May 2025); EU KLEMS & INTANProd (2024 release). Full working: the factors note.