| Rung | Denominator | GB total | GVA per unit |
|---|---|---|---|
| D0 | Full-time employee jobs (the web blocks) | 21.3m | £99,500 |
| D1 | All employee jobs | 30.8m | £68,700 |
| D2 | Crude FTE: full-time + half of part-time | 26.0m | £81,300 |
| D3 | ASHE-weighted FTE: full-time + part-time × (part-time hours ÷ full-time hours) | 25.7m | £82,300 |
| D4 | Paid employee hours | 1,000m hours a week | £40.7 an hour |
| D5e | Employee hours actually worked | 832m hours a week | £48.9 an hour |
| D5 | All hours actually worked: D5e + the self-employed (hybrid method) | 937m hours a week | £43.7 an hour |
Jobs or hours?
Q2: what GVA per full-time job hides, and the hours behind BRES jobs
In short (GB, 2023 unless stated; current prices; imputed rent excluded):
- GVA per full-time job, the web blocks’ measure, overstates GVA per full-time equivalent by 21% for the economy as a whole, and unevenly: most in sectors where part-time work is common, up to 68% in retail.
- Counting hours reorders sectors. Retail, food and drink service and care fall; full-time, standard-week industries rise. Within a single place the order of its sectors mostly holds.
- The self-employed matter as much as the hours. Adding their hours takes GVA per hour from £48.9 (employees only) to £43.7, and by a third or more in construction, the arts and personal services.
- Against ONS, the shape agrees and the level gap is the expected one. With the self-employed, our hours are 0.93 of ONS’s at ITL3 (median, 2023), against about 0.94 if the only difference were ONS’s older way of measuring hours.
- How the self-employed are placed matters locally, not nationally, and ASHE’s sampling error is small next to the choice of denominator.
The question is the plan’s Q2: how does GVA per full-time job, the measure in the RegionalEconomicTools web blocks, compare levels-wise with other approaches, once we estimate the hours that BRES full-time and part-time jobs represent? The full working is in the Q2 note.
1 The denominator ladder
GVA per worker depends on what counts as a worker. The build divides the same GVA by six denominators, for 169 GB ITL3 areas × 46 GVA categories × 2015–2023:
How each rung is built:
- Jobs (D0, D1). BRES full-time and part-time employee jobs, downloaded from Nomis at 5-digit SIC and summed to 2-digit, for 2021 local authorities mapped to 2025 ITL3s. Scotland’s 2023–24 gap at district level is filled from council-area files (§6). Script:
claude_research/productivity/R/02_bres.R. - Hours per job (D2–D4). ASHE Table 5 mean paid weekly hours by region × 2-digit SIC, full-time and part-time separately. Gaps are filled from UK × division, then region × section, then UK × section. After filling, 99.8% of full-time jobs and 97.9% of part-time jobs get hours from their own region × division. Scripts:
claude_research/productivity/R/01_ashe_table5.R,claude_research/productivity/R/03_denominators.R. - Hours worked (D5e). Paid hours × ONS’s component-approach ratio of actual to paid hours per employee job: 0.858 in 2015, 0.738 in 2020 (furlough) and 0.838 in 2024. One UK ratio per year, so it moves levels but never the ranking of sectors within a year. Script:
claude_research/productivity/R/04_gva_per_denominator.R. - All hours (D5). D5e plus self-employed hours (Section 3).
- GVA. ONS regional GVA (balanced) by industry, the April 2025 release as corrected by ONS in October 2025 (“v13”); current prices for levels, chained volume for growth. Script:
claude_research/productivity/R/01b_gva.R.
Check against the web blocks. The D0 rung, in chained volume and 3-year averages, reproduced the published web blocks exactly wherever it should (checked 2026-11-03), apart from two explained faults in the blocks’ inputs (§6).
2 What moves, by sector
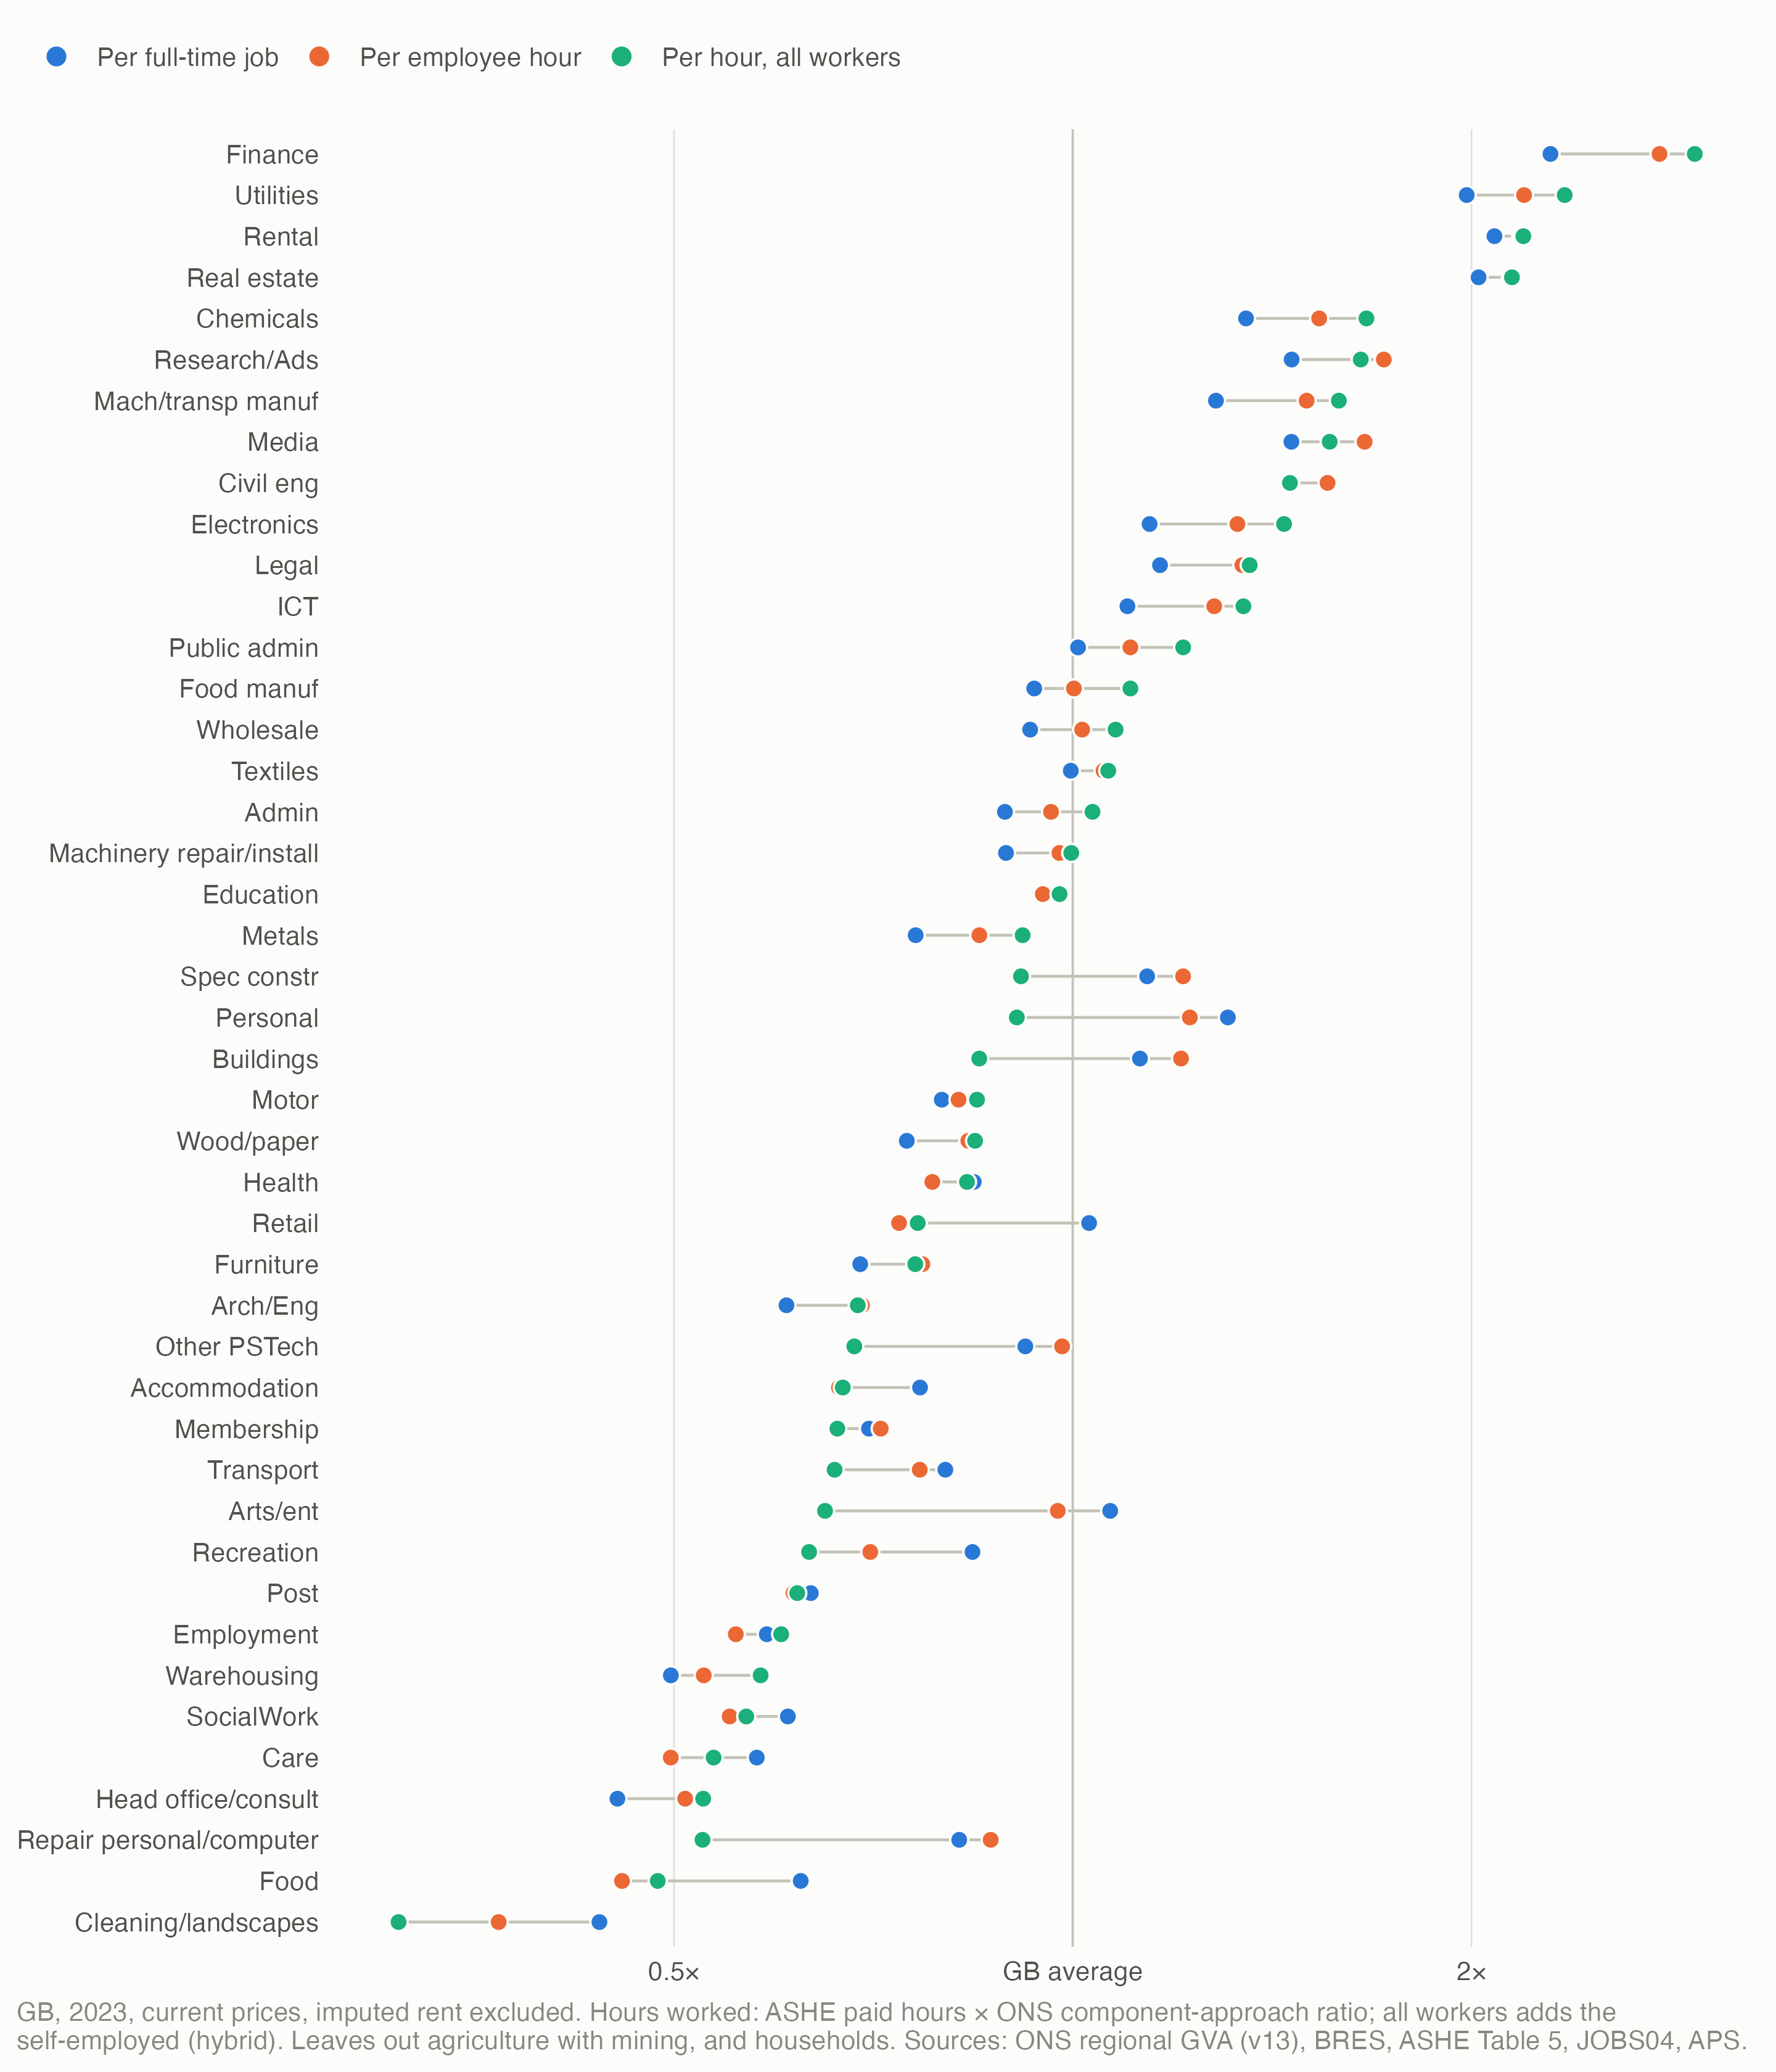
Part-time share is the main driver. GVA per full-time job divides all of a sector’s GVA, part-time workers’ output included, by its full-time jobs alone. So it flatters sectors where many jobs are part-time. Against GVA per FTE (D3) it is too high by:
| Sector | Overstatement | Per full-time job | Per FTE | Per hour, all workers | Rank: full-time job → paid hour → all workers |
|---|---|---|---|---|---|
| Retail | 68% | £102,000 | £61,000 | £33.4 | 17 → 32 → 27 |
| Food | 59% | £62,000 | £39,000 | £21.2 | 37 → 43 → 43 |
| Recreation | 45% | £84,000 | £58,000 | £27.6 | 27 → 34 → 35 |
| Education | 37% | £97,000 | £71,000 | £42.7 | 20 → 24 → 19 |
| SocialWork | 36% | £61,000 | £45,000 | £24.8 | 38 → 39 → 39 |
| Cleaning/landscapes | 36% | £44,000 | £32,000 | £13.5 | 44 → 44 → 44 |
| Accommodation | 36% | £76,000 | £56,000 | £29.3 | 31 → 36 → 31 |
| Arts/ent | 35% | £106,000 | £79,000 | £28.4 | 16 → 22 → 34 |
| Care | 33% | £57,000 | £43,000 | £23.4 | 41 → 42 → 40 |
| Health | 33% | £84,000 | £63,000 | £36.3 | 26 → 29 → 26 |
| Wood/paper | 4% | £75,000 | £71,000 | £36.9 | 33 → 27 → 25 |
| Civil eng | 4% | £145,000 | £140,000 | £63.7 | 7 → 7 → 9 |
| Metals | 4% | £76,000 | £73,000 | £40.0 | 32 → 26 → 20 |
| Chemicals | 4% | £134,000 | £130,000 | £72.8 | 8 → 8 → 5 |
| Mach/transp manuf | 3% | £128,000 | £124,000 | £69.4 | 10 → 9 → 7 |
- The length of a full-time week matters too. Paid hours per FTE run from 35.3 a week (Education) to 43.4 (Transport). So sectors with long full-time weeks look less productive per hour than per FTE.
- Rankings shift between sectors. Ranked by GVA per paid hour instead of per full-time job, retail moves from 17 to 32 of 44; with all workers’ hours, to 27.
- Within a place, the order mostly holds. Across the 169 ITL3s, sectors ranked by GVA per full-time job and by GVA per paid hour have a median rank correlation of 0.96, lowest 0.85 (Kingston upon Hull, City of). Against GVA per hour by all workers the median is 0.89. So the denominator changes comparisons between sectors far more than it reorders any one place’s sectors. That fits the circularity in §4: at ITL3, GVA and the denominators share ASHE and BRES.
3 The self-employed
GVA includes what the self-employed produce, but BRES counts employees only, so GVA per employee hour overstates productivity wherever self-employment is common. Version 2 adds them (script: claude_research/productivity/R/03b_self_employed.R).
Hours per self-employed job. JOBS04’s GB self-employment jobs by division, full-time and part-time (September quarter), valued at the LFS average actual weekly hours of all full-time and all part-time workers (HOUR01, July–September), and scaled to ONS’s component basis (component reference tables, Table 3). That gives 26.4 hours a week per job in 2023 (28.4 in 2015, 22.8 in 2020). The assumption, flagged: the self-employed work the same hours as other full-time or part-time workers. No published table gives their actual hours by industry.
Placing them in ITL3s, three ways:
| Step | National split | APS-led | Hybrid (the default) |
|---|---|---|---|
| GB totals by industry | JOBS04 jobs by division | Workplace APS self-employment in 9 broad industry groups | As the national split |
| To regions | The APS’s regional share of each broad group | The APS’s regional estimates | As the national split |
| Within regions | Like BRES employee jobs in the same division | The APS’s local-authority estimates; suppressed cells share the region’s leftover total like BRES employee jobs | As the APS-led method |
| Broad groups to divisions | Already by division | Each area’s mix from the national split | As the APS-led method |
| GB jobs, 2023 (169 ITL3s) | 3.96m | 4.16m | 3.96m |
The hybrid starts from the APS-led figures and fits them, by iterative proportional fitting, to the national split’s totals by region × broad group and by division across GB. So it has the national split’s industry detail and regional shares exactly, and differs only in spreading each region’s self-employment across its areas like the local survey rather than like employees.
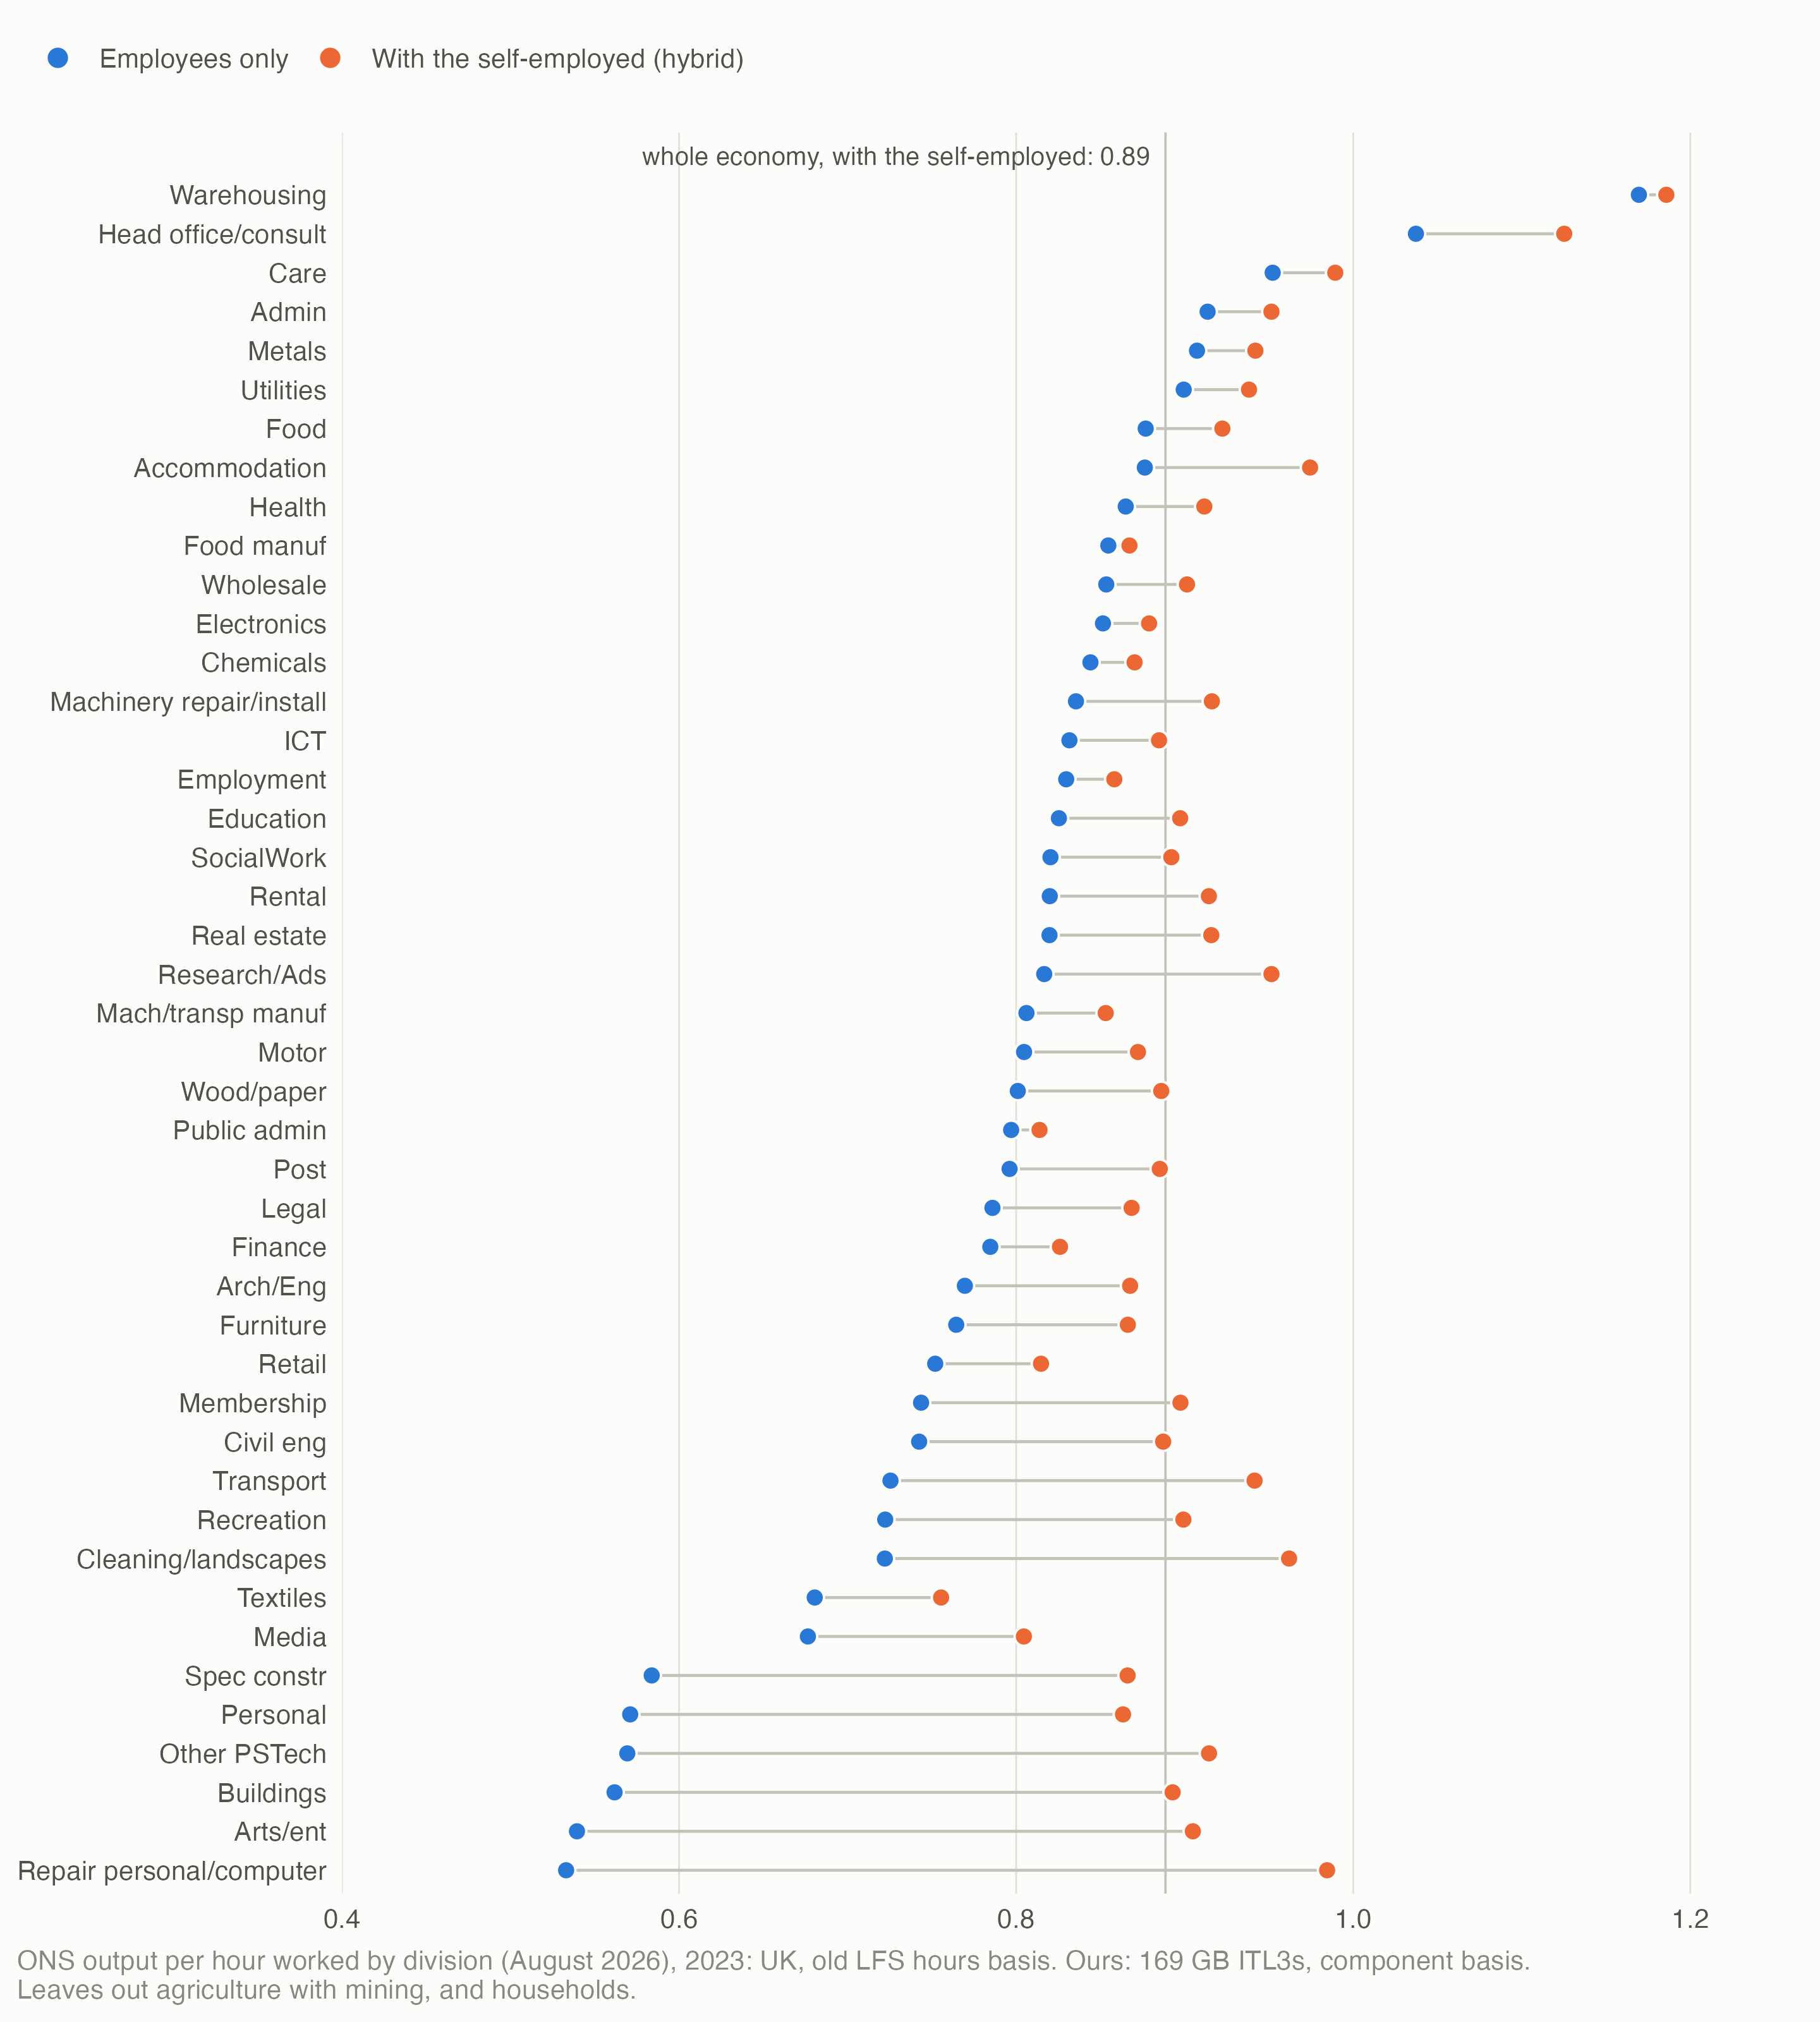
The six industries where employee hours fell furthest short of ONS’s (repair of personal goods, the arts, other professional services, construction of buildings, personal services and specialised construction) go from 0.53–0.58 to 0.86–0.98 with the self-employed. In money:
| Sector | Self-employed share of hours | Per employee hour | All workers: hybrid | National split | APS-led | Rank of 44, employees → all |
|---|---|---|---|---|---|---|
| Repair personal/computer | 46% | £42.4 | £23.0 | £23.0 | £23.3 | 25 → 42 |
| Arts/ent | 40% | £47.6 | £28.4 | £28.4 | £28.6 | 22 → 34 |
| Other PSTech | 38% | £48.0 | £29.9 | £29.9 | £28.9 | 20 → 30 |
| Buildings | 37% | £59.0 | £37.1 | £37.1 | £36.1 | 15 → 23 |
| Personal | 34% | £59.9 | £39.6 | £39.6 | £39.2 | 13 → 22 |
| Spec constr | 33% | £59.2 | £39.9 | £39.9 | £39.3 | 14 → 21 |
| Cleaning/landscapes | 25% | £18.0 | £13.5 | £13.5 | £13.4 | 44 → 44 |
| Transport | 23% | £37.5 | £28.9 | £28.9 | £27.5 | 31 → 33 |
| Finance | 5% | £135.6 | £128.8 | £128.8 | £129.1 | 1 → 1 |
Does the method matter? The hybrid and the national split agree down to region × broad group, so comparing them isolates the one real choice: whether a region’s self-employed are spread across its areas like the local survey or like employees.
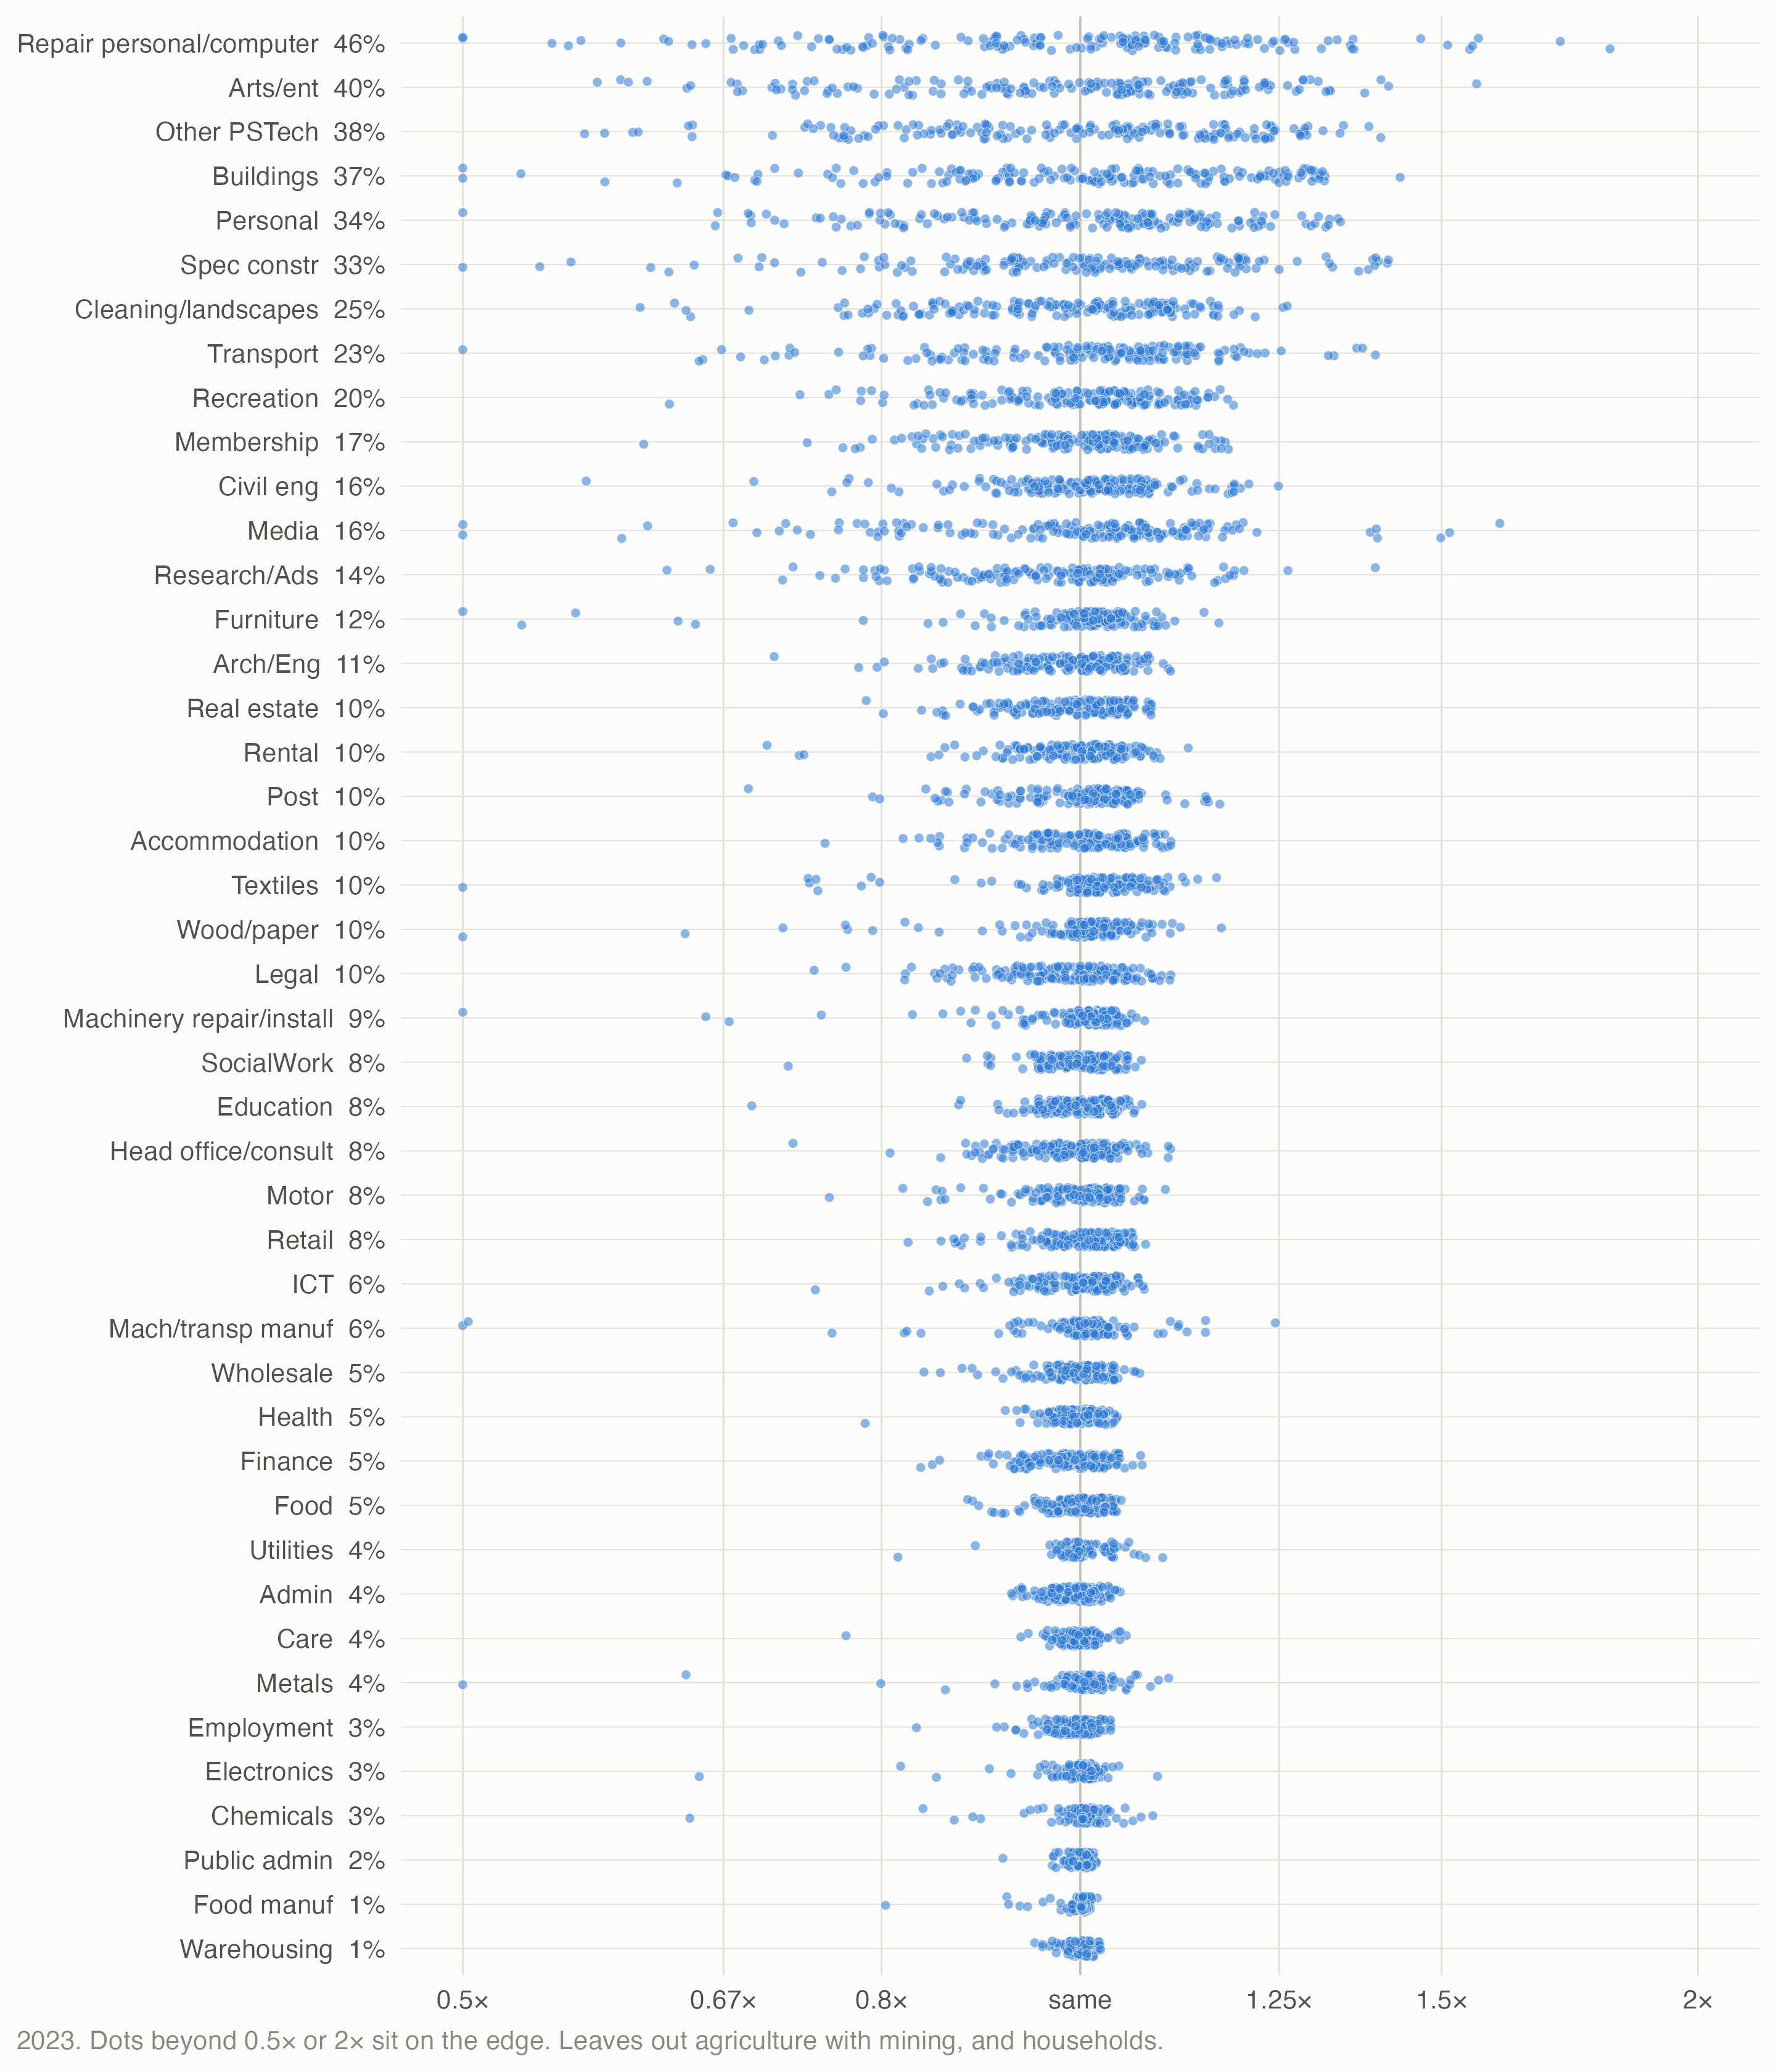
- Nationally, hardly. The hybrid and the national split agree exactly at GB level, by construction. The APS-led method differs from them by at most 5% by sector.
- For whole places, a little. In 90% of ITL3s the hybrid’s whole-economy GVA per hour is within 6.4% of the national split’s. It’s lowest in Dumfries and Galloway and Mid Wales, 12% lower: rural areas where the local survey finds more self-employment than employee counts imply.
- For one sector in one place, a lot. Across all ITL3 × sector cells the two agree within 10% in 82% of cells. Where the self-employed work a fifth or more of a sector’s hours, only 43% agree within 10%, and 20% differ by more than 25%. There the placement choice decides the answer.
4 Against ONS’s figures
None of these comparisons is like-for-like, and the differences are the point. Ours counts employees, plus the self-employed in D5, with hours on ONS’s new component basis, for 169 GB ITL3s. ONS’s figures count all workers, on the older LFS basis, which ONS now says overstates hours because it misses leave. The useful tests are whether the shape agrees, and whether the level gap is the one the change of basis predicts. Script: claude_research/productivity/R/05_benchmarks.R.
| Version | Our hours ÷ ONS’s (median) | Spread | Rank correlation of GVA per hour with ONS |
|---|---|---|---|
| Employees only | 0.823 | 0.090 | 0.875 |
| With the self-employed: hybrid | 0.930 | 0.071 | 0.930 |
| National split | 0.921 | 0.078 | 0.906 |
| APS-led | 0.935 | 0.071 | 0.929 |
- The level gap is what the change of basis predicts, nearly. ONS’s subregional hours are on the old basis, which counts 6% more hours than the component basis in 2023, so full agreement would put our hours at about 0.94 of ONS’s. Summed over the 169 ITL3s, our all-worker hours come out 1.2%–2.7% below that in every year from 2015 to 2023. One candidate is the hours assumption for the self-employed.
- Places: shape agrees. Ranked by GVA per hour, the 169 ITL3s correlate 0.93 with ONS’s ranking with the self-employed (hybrid), 0.88 for employees only. ONS also places the self-employed with APS data, so part of the hybrid’s fit is by construction.
- Jobs overshoot. Employee jobs plus self-employment jobs come to 1.02–1.04 of ONS’s subregional jobs (34.8m against 33.3m in 2023). Not yet explained (§7).
- Regions × industries (INDBYREG, ITL1 × 16 groups, 2015–19). The spread of our hours ratio across cells halves with the self-employed: 0.194 to 0.109.
- Industries (UK, 2023). Whole-economy hours ratio 0.79 for employees, 0.89 with the self-employed (ONS’s figures cover the UK, ours GB). Across 44 industry groups (leaving out households and agriculture with mining), GVA per hour correlates 0.89 with ONS’s ranking for employees only and 0.96 with the self-employed.
- Two anomalies: warehousing and head offices, where our hours exceed ONS’s (1.17 and 1.04 for employees alone). Both also have strikingly low GVA per job. Page 1 has evidence on why (A1’s checks §2.2), still to confirm.
5 How precise is it?
| Measure | Median | 90th percentile | 99th percentile |
|---|---|---|---|
| GVA per FTE (D3) | ±1.2% | ±3.1% | ±6.7% |
| GVA per employee hour (D5e) | ±2.3% | ±4.4% | ±7.3% |
| GVA per hour, all workers (D5; ASHE error only) | ±1.9% | ±3.5% | ±5.7% |
ASHE’s sampling error, carried through the ladder analytically, is small next to the choice of denominator (overstatements of 3–68% in Table 2). The widest bands are small cells. Not in these bands: BRES’s own sampling error (ONS doesn’t publish it below region, where part-time CVs already reach 17–25%); the error from borrowing a coarser cell’s hours; any error in GVA; and the self-employed estimates’ survey error. So the bands are a floor, not the full uncertainty.
6 Data problems found along the way
These came out of checks against RegionalEconomicTools’ files on 2026-11-03. Nothing there has been changed: the owner’s decision.
- Scotland 2023–24 is missing at district level. Nomis has no district-level BRES for any Scottish council area in 2023 or 2024 (status “Q” in every cell). RegionalEconomicTools records Scotland as zero jobs in those years, and the web blocks’ latest point (the 2021–23 average, labelled 2022) averages in the zero: GVA per full-time job for all 18 Scottish ITL3s is a median 1.51× too high across 688 cells. This build fills the gap from council-area files, which agree with district level in 99.3% of cells for 2015–22.
- Agriculture is undercounted locally, and inconsistently. BRES carries farm employment (the “DEFRA/Scottish Executive agricultural data” line) at district level only for 2020–22, about 120,000 full-time jobs. Including it where present puts breaks in agriculture in 2020 and 2023; this build leaves it out everywhere. Either way agriculture with mining is badly undercounted at ITL3 and left out of the figures here.
- The web blocks’ GVA predates ONS’s correction. Their regional GVA files are ONS’s original April 2025 release. ONS corrected the deflation and chain-linking on 10 October 2025, changing about 4% of ITL3 chained-volume cells (real estate 92% of its cells, public administration 87%). In the web blocks’ years real estate’s GVA per full-time job is a median 1.6% too high (at most 3.4%).
- Summing from 5-digit isn’t quite neutral for part-time: in 2024 the summed part-time total is 0.5% below the published 2-digit total, though the median cell difference is zero.
- A download bug, caught. R writes 100000 as “1e+05”; Nomis reads that offset as 0 and resends the first page. That silently dropped 66 local authorities a year until a completeness check caught it.
7 Open questions
- Do the self-employed work longer weeks than other workers? Our all-worker hours fall 1–3% short of ONS’s after allowing for the change of basis, and INDBYREG’s hours per job run above ours. LFS microdata would settle it.
- Why do employee plus self-employment jobs exceed ONS’s local jobs by 4–5%? Perhaps because ONS’s local jobs come from the household survey (LFS/APS), which counts fewer jobs than employer surveys like BRES. Not checked.
- Warehousing and head offices: a classification mismatch between where jobs and output are recorded? (Page 1.)
- Industry hours ratios. ONS’s ratios of hours worked to paid hours by industry are due in February 2027; they’d replace the single UK ratio.
- Self-employed survey error isn’t in the bands; the APS publishes confidence intervals that could be carried through.
- A BRES error band, using ONS’s region × broad-industry CVs as a floor.
- Northern Ireland isn’t covered: BRES on Nomis is GB only.
Data and code. Pipeline: claude_research/productivity/R/run_all.R runs steps claude_research/productivity/R/01_ashe_table5.R to claude_research/productivity/R/06_figures.R; settings in claude_research/productivity/R/00_config.R. Data as of: BRES (Nomis release of 28 October 2025), ASHE Table 5 to 2026 provisional, regional GVA v13 (April 2025 as corrected October 2025), JOBS04 (15 September 2026), APS to December 2024, ONS subregional productivity (June 2025), output per hour by division (August 2026). Full working: the Q2 note.