| Version | Median ratio | Spread | Range, any year | Rank correlation |
|---|---|---|---|---|
| Per employee job | 1.08–1.12 | 0.058–0.074 | 0.94–1.38 | 0.93–0.95 |
| Per filled job, hybrid (default) | 0.96–0.98 | 0.019–0.035 | 0.81–1.07 | 0.98–0.99 |
| Per filled job, national split | 0.96–0.98 | 0.050–0.061 | 0.81–1.18 | 0.95–0.97 |
| Per filled job, APS-led | 0.95–0.97 | 0.018–0.033 | 0.80–1.06 | 0.98–0.99 |
What’s measured, and how far it agrees
Q1: region × industry output, against ONS’s own figures
In short:
- Nothing else publishes output per job or per hour at this detail. ONS’s regional GVA reaches 47 industries at ITL3, but no published jobs or hours denominator matches it; dividing by BRES jobs is the only free route. Below ITL2 × 33 industries, though, the GVA is allocated rather than measured.
- Whole places agree with ONS once the self-employed are counted. Our GVA per filled job is a median 0.96–0.98 of ONS’s across 169 ITL3s (2015–2023), with rank correlations of 0.98–0.99. The GVA is the same; the gap is in job counts.
- Sectors within a region agree; regions within a sector agree less. Against ONS’s lapsed INDBYREG, industries’ ranking within a region matches at 0.96 (median), regions’ ranking within an industry at only 0.83, and as low as 0.53.
- Regional GVA departs from the Annual Business Survey by more than the survey’s sampling error in 24% of region × industry cells (2012–22), where 5% would be expected.
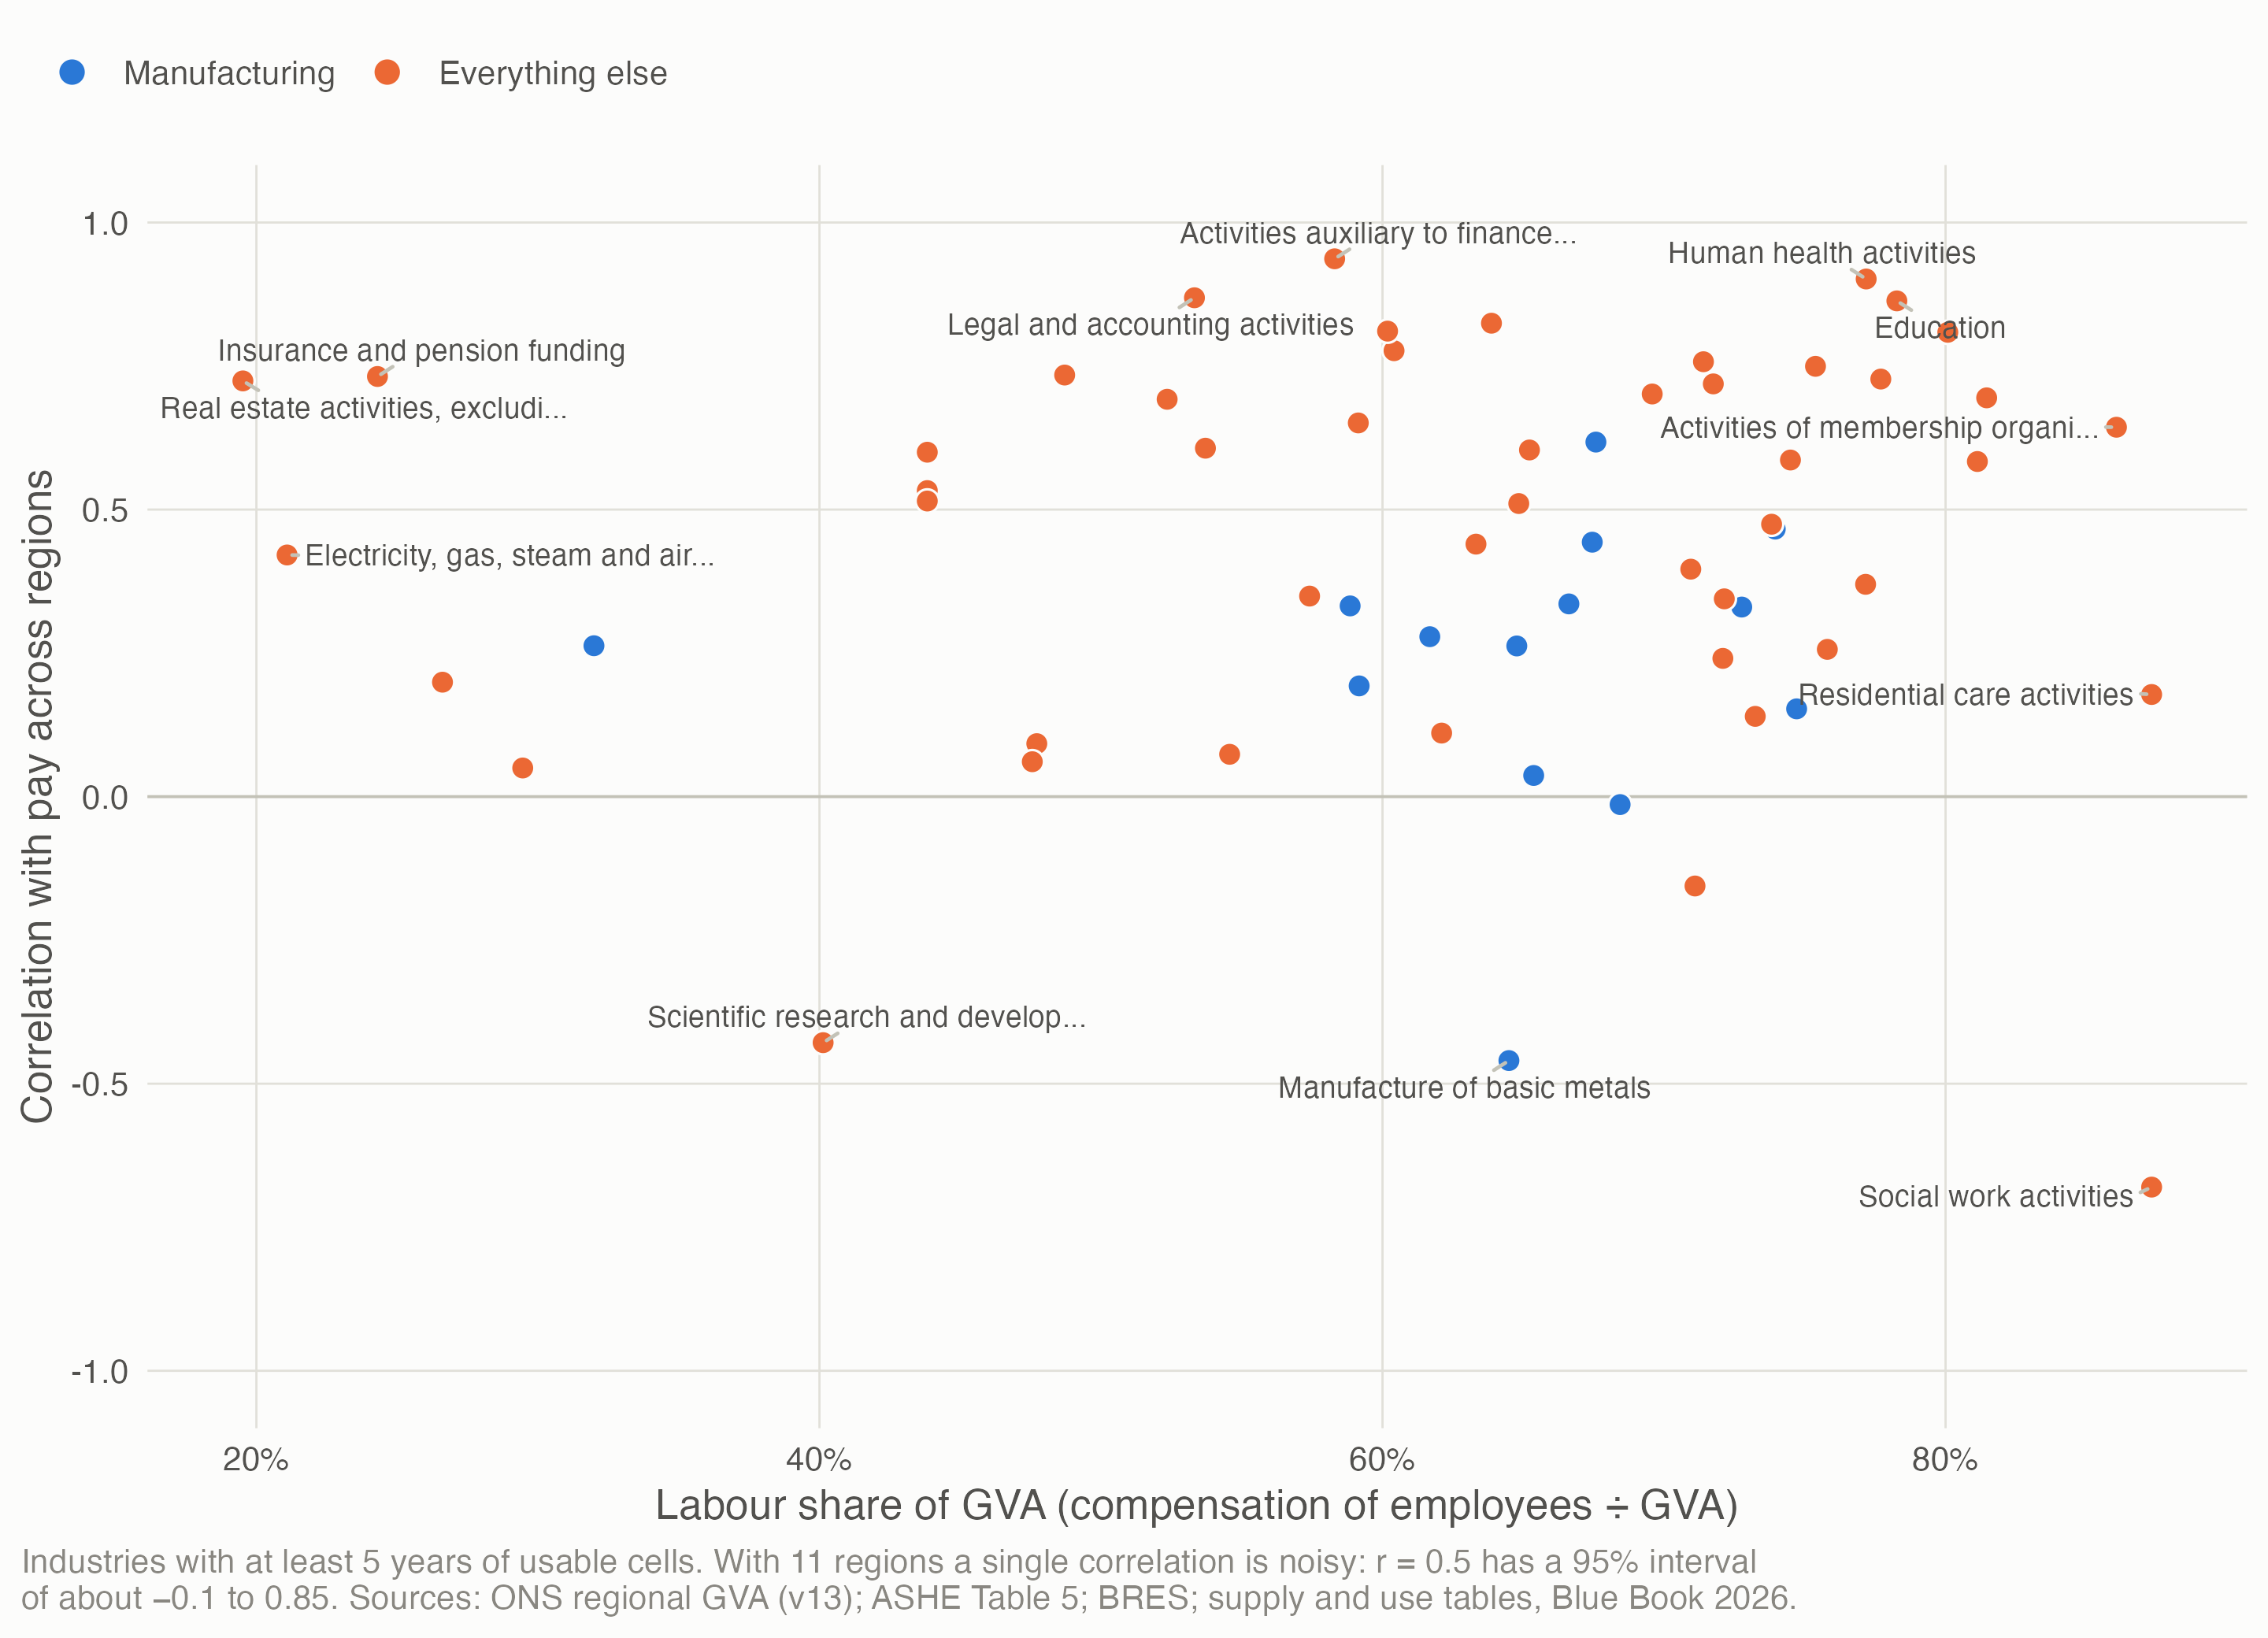
- GVA per job isn’t simply pay, at region level. The plan expected regional GVA per job to track pay where labour’s share of income is high. It doesn’t: the labour share doesn’t predict which industries track pay.
- ONS’s own quality scores for the estimates that set ITL3 detail collapsed from 2022. The share of cells scored low rose from about a fifth to 47% in 2023 and 86% in 2024 (provisional).
This page covers the plan’s Q1: how regional GVA linked to BRES compares with other ways of measuring output, and whether anything else reaches this level of industry detail. It draws on R1’s survey of sources (the landscape note, sources checked 2026-11-03) and A1’s four consistency checks (the checks note, 2026-11-04).
1 What reaches region × industry
No other source publishes output per job or per hour at ITL3 × 47 industries, or ITL2 × 74. ONS publishes balanced regional GVA at 47 non-overlapping industries for ITL3, 74 for ITL2 and 82 for ITL1, but no matching jobs or hours denominator. ONS does the division internally (BRES jobs × APS hours) and publishes only whole-economy productivity below ITL1. The finest published alternatives are much coarser:
| Source | Owner | Geography × industry | Measure | Years | Status |
|---|---|---|---|---|---|
| Industry by region labour productivity (INDBYREG) | ONS | ITL1 × 16 industry groups | GVA per hour and per job | 1998–2019 | Lapsed (July 2021) |
| Scottish Annual Business Statistics | Scottish Government | 32 council areas × 24 groups | Approximate GVA per head, non-financial business economy | 2008–2023 | Current (2023 edition) |
| Regional database, labour productivity by activity | OECD | UK TL3 × 10 activities | GVA per worker | To 2024 | Current |
| ARDECO | European Commission | UK NUTS3 × 10 sectors | Hours and employment (GVA by sector in current prices) | Hours to 2019 | Current; UK only in the NUTS 2016 version |
| Annual Business Survey, regional results | ONS | ITL1 × about 80 divisions | Approximate GVA, turnover, purchases (no jobs) | 2008–2024 | Current |
| Regional and subregional productivity | ONS | ITL1 to local authority | GVA per hour and per filled job, whole economy only | To 2023 (2024 due 24 November 2026) | Official statistics in development |
Internationally the picture is similar. Eurostat’s regional tables carry 10 industries and no longer any UK rows. Statistics Canada currently publishes labour productivity by province at 2-digit industry only. The US publishes GDP and jobs by county × industry, but no hours below state level.
Detail isn’t independence. ONS balances its income and production estimates at ITL2 × 33 industries. Below that, regional GVA is allocated rather than measured. ITL3 detail comes from the income approach, which spreads compensation of employees using ASHE pay × BRES jobs. So the BRES-linked figures reach further than anything else partly because they rest on allocation: they are GVA per job as allocated. The checks below test how far that matters.
2 GVA per job against ONS’s own figures
ITL3, whole economy. Ours: GVA (without imputed rent) per BRES employee job, and per filled job (employees plus the self-employed). ONS’s: subregional GVA per filled job (June 2025), with imputed rent taken out. Our GVA matches ONS’s to within half a per cent, so the ratio is really ONS’s job count over ours.
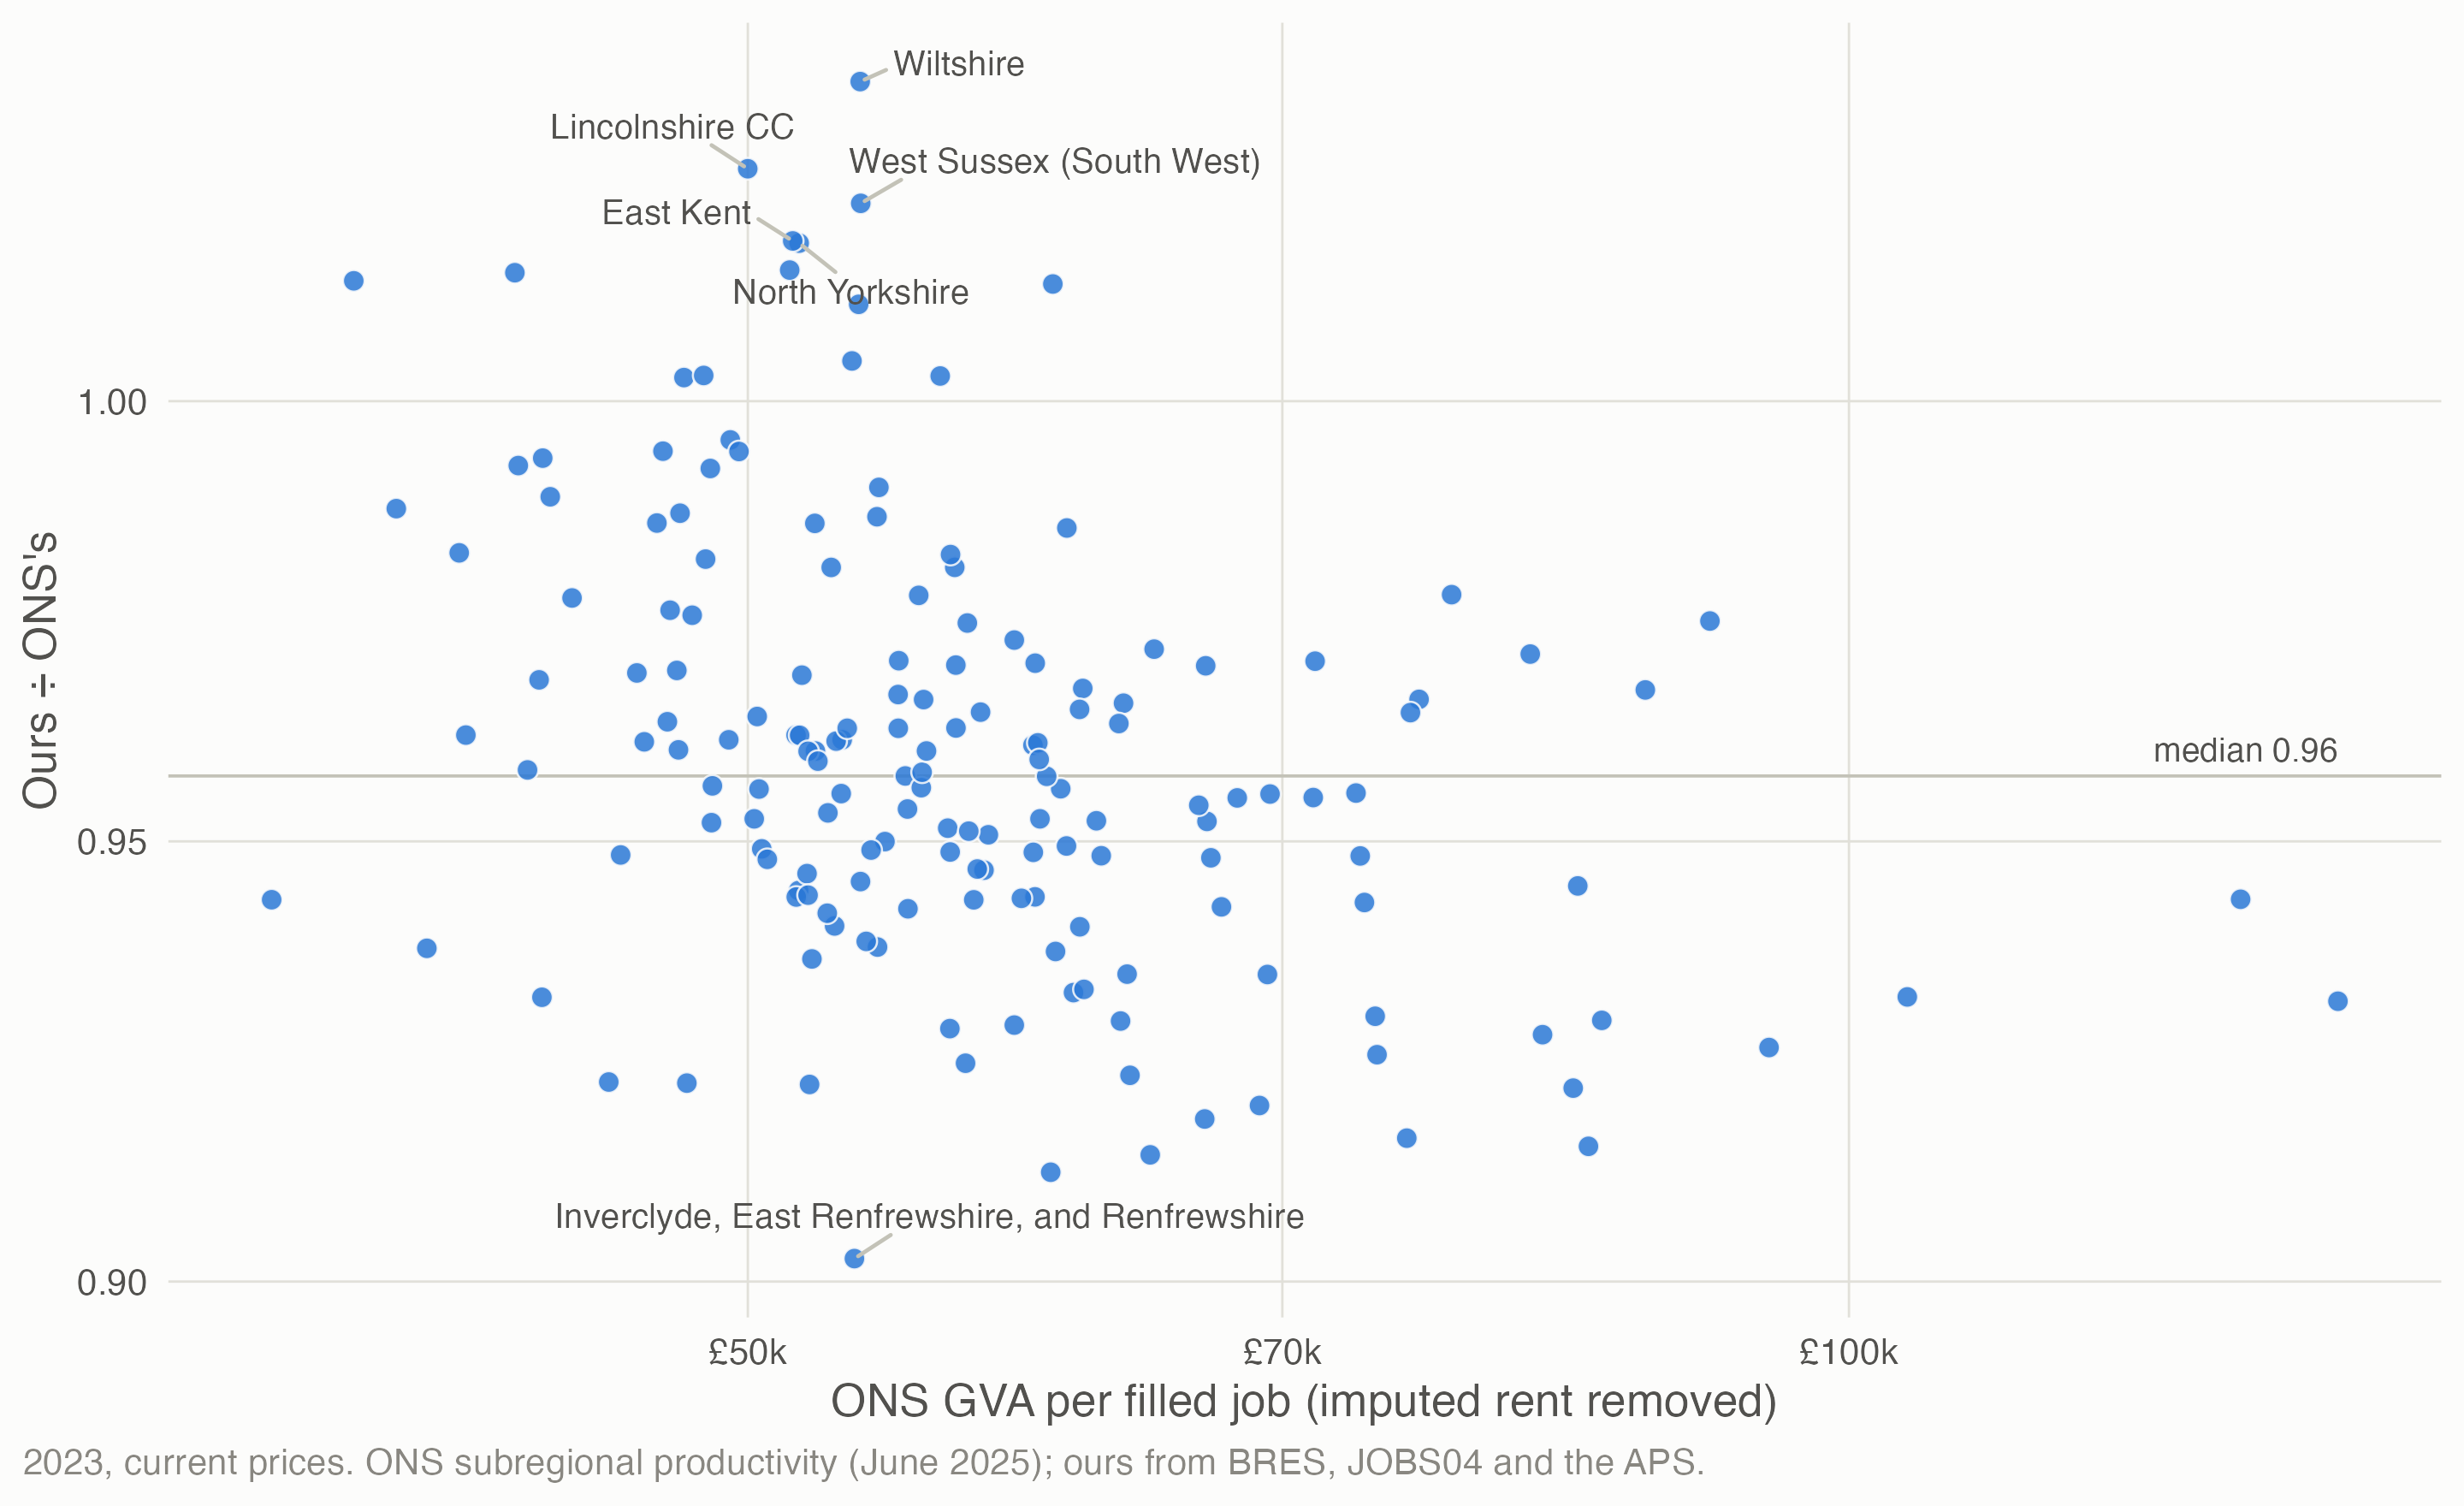
- In 2023, 93% of ITL3s lie within 5% of the median ratio per filled job, against 67% per employee job.
- We count more jobs than ONS in employment centres, fewer in rural areas. In rural ITL3s local BRES leaves out farm employees, which pushes our GVA per job above ONS’s. In city centres our count of employee jobs alone comes close to ONS’s filled jobs.
ITL1 × 16 industry groups, against INDBYREG (2015–19).
| Version | Median ratio | Rank correlation, all cells | Within a region, across industries (median) | Within an industry, across regions (median) | … lowest |
|---|---|---|---|---|---|
| Per employee job | 1.08–1.09 | 0.96–0.97 | 0.95–0.97 | 0.76–0.88 | −0.05 |
| Per filled job, hybrid | 0.95–0.96 | 0.98–0.99 | 0.96–0.98 | 0.83–0.93 | 0.51 |
- For comparing sectors within a region, our figures reproduce ONS’s ordering almost exactly. For comparing regions within a sector they agree less well: the comparison the research plan already flags as weakest.
- ONS’s own revisions move some industries more than the denominator does. INDBYREG used regional GVA as published in 2021. Summed over GB regions, our 2025-vintage GVA for finance in 2019 is 1.29 times INDBYREG’s.
3 Regional GVA against the Annual Business Survey
The Annual Business Survey (ABS) is the one independent survey measure of output by region × industry. Its approximate GVA (aGVA) isn’t the same measure as regional GVA: it covers only the non-financial business economy, and has none of the national accounts’ adjustments. So A1 compared each region’s share of the UK industry total, using the standard errors ABS publishes for region × division (2024 quality-measures edition, 4 June 2026). Regional GVA has no published error, so “diverging” means outside ABS’s sampling error, not wrong.
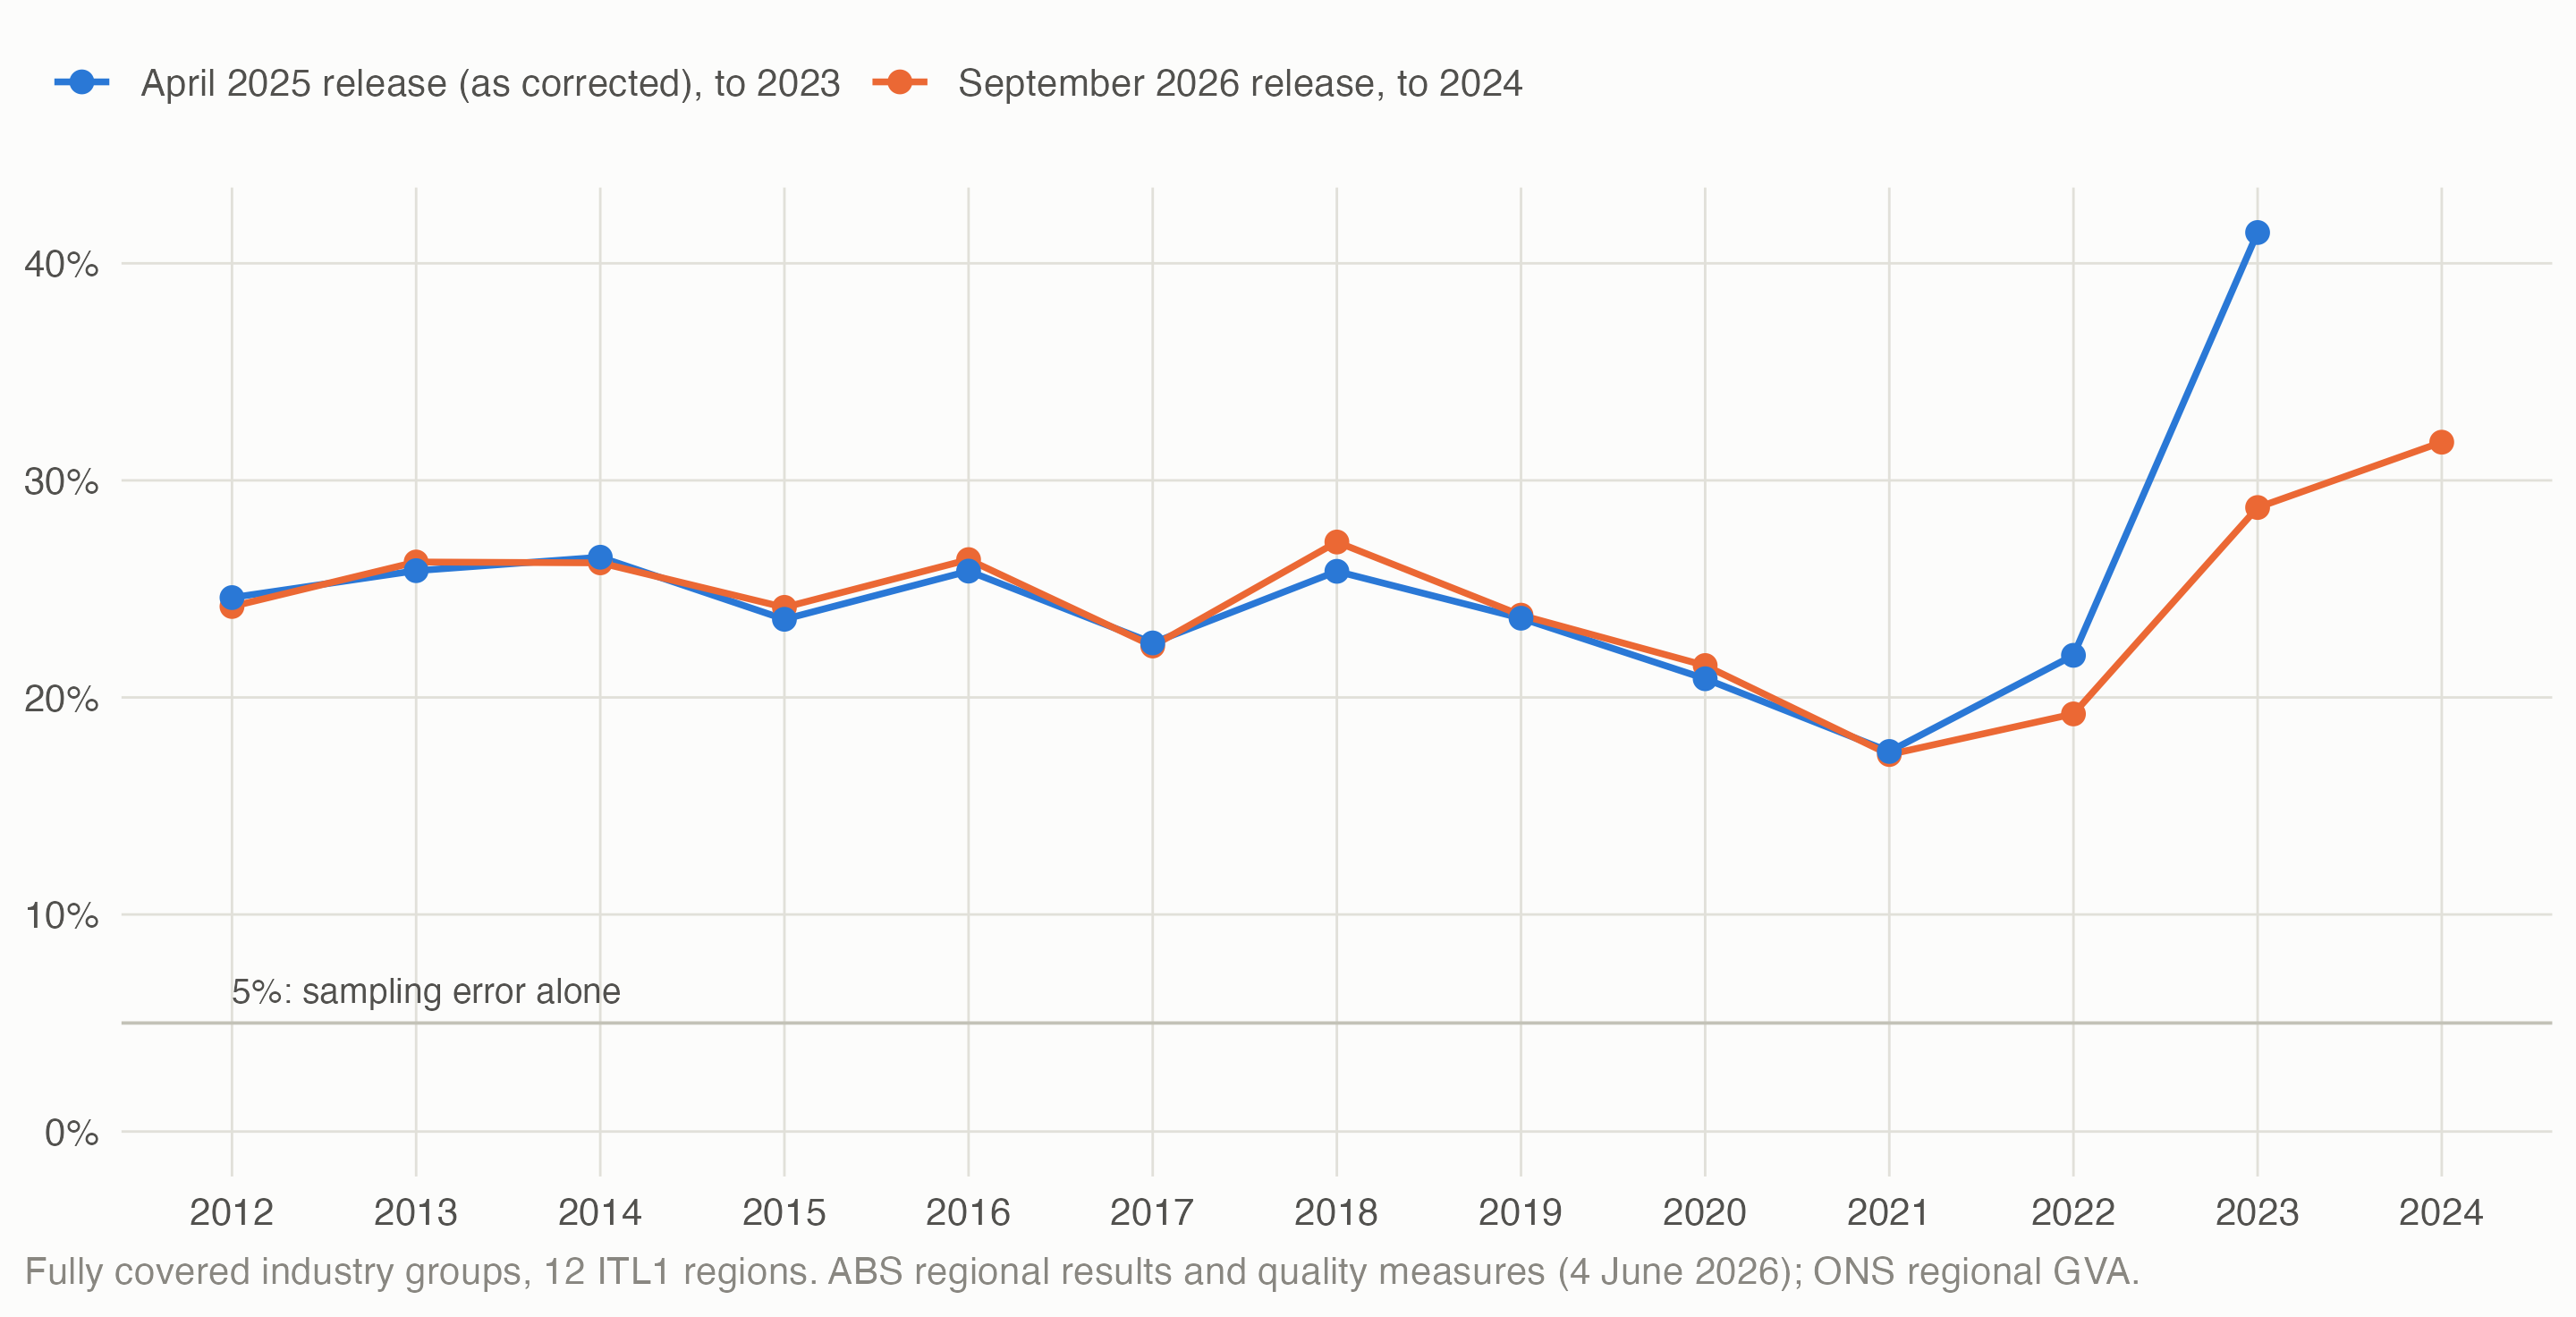
- About five times what sampling error alone would give. Pooled over 2012–22, 23.6% of 7,868 cells lie outside ABS’s 95% interval.
- The latest year of each release diverges most, as the figure shows.
- By region: most often in Northern Ireland (45%) and Scotland (33%), least in the South East (14%).
- The levels differ by industry, as expected, but in a telling pattern. In 2023, UK regional GVA ÷ aGVA is lowest for head offices and management consultancy (0.32); air transport (0.37); warehousing and transport support (0.41); architectural and engineering (0.51), and highest for libraries, archives, museums and other cultural (3.49); manufacture of motor vehicles (2.73); programming and broadcasting (2.32); sewerage (2.31). Some of the high ratios are coverage (households and sole traders aren’t on the business register). The low ones suggest a classification difference: ABS’s regional results classify each site by its own activity (§6).
| Region | Industry | Regional GVA’s share | ABS’s share | z | GVA at stake |
|---|---|---|---|---|---|
| Scotland | Human health activities (86) | 9.2% | 3.8% | 32.7 | £6.8bn |
| London | Human health activities (86) | 17.0% | 21.6% | −2.0 | £5.8bn |
| London | Wholesale trade (46) | 20.7% | 27.0% | −7.8 | £5.6bn |
| South East | Human health activities (86) | 12.4% | 15.5% | −2.2 | £4.0bn |
| London | Construction of buildings (41) | 24.3% | 16.5% | 4.2 | £3.7bn |
| London | Computer programming and consultancy (62) | 36.7% | 41.6% | −3.2 | £3.0bn |
So ABS’s sampling error isn’t a sufficient error band for regional GVA by industry. The divergences mix regional GVA’s own error with differences of definition and classification, so they don’t measure that error directly. Nothing comparable exists below ITL1.
4 Is it just pay? The circularity test
The worry. ONS spreads compensation of employees, about half of GVA, across regions using ASHE pay × BRES jobs. Divide by BRES jobs and that part of GVA per job is ASHE pay per job, by construction. So the higher an industry’s labour share, the more its regional pattern of GVA per job should just be its pay pattern. (RegionalEconomicTools’ jobs-and-hours note §7 calls the labour share “the severity dial”.)
The test. For each industry and year, across the 11 GB regions: the correlation between log GVA per employee job and log ASHE pay per job (mean gross annual pay, full-time and part-time weighted as the jobs are counted), with industries split by labour share from the Blue Book 2026 supply and use tables.
| Labour share | Industries | Median correlation | Share of industry-years above 0.9 | Median share of regional variation removed by dividing by pay |
|---|---|---|---|---|
| Below 45% | 11 | 0.42 | 3% | 5% |
| 45–65% | 28 | 0.56 | 6% | 15% |
| Above 65% | 32 | 0.51 | 4% | 21% |
- The prediction fails at this level. Correlations don’t approach 1 in labour-intensive industries, and the labour share doesn’t sort industries by how much GVA per job tracks pay: the rank correlation between them across 71 industries is 0.06.
- Where GVA per job does track pay (median correlation 0.78–0.94): auxiliary financial services, human health, legal and accounting, education, wholesale, accommodation and food, retail. Health and education are non-market services whose output is measured by their inputs, so this is circular by definition; the test finding them is a sign it works.
- Where it doesn’t: most of manufacturing, social work, residential care, scientific research.
- London carries part of it. Without London the median correlations by band fall from 0.42–0.56 to 0.28–0.37.
- At ITL3, where the worry is sharpest, it can’t be tested with published data: ASHE publishes pay by industry only for regions, and regional pay with the local job mix barely varies within a region.
5 ONS’s own quality scores
With each release ONS publishes the quality scores it uses to balance the income and production estimates, for each ITL2 area × 33 industries × year, on a 0–1 scale. A score of 0.6 corresponds to a coefficient of variation of 20%; below 0.6 is “low” here. The income approach (ASHE × BRES) is the one that sets ITL3 detail.
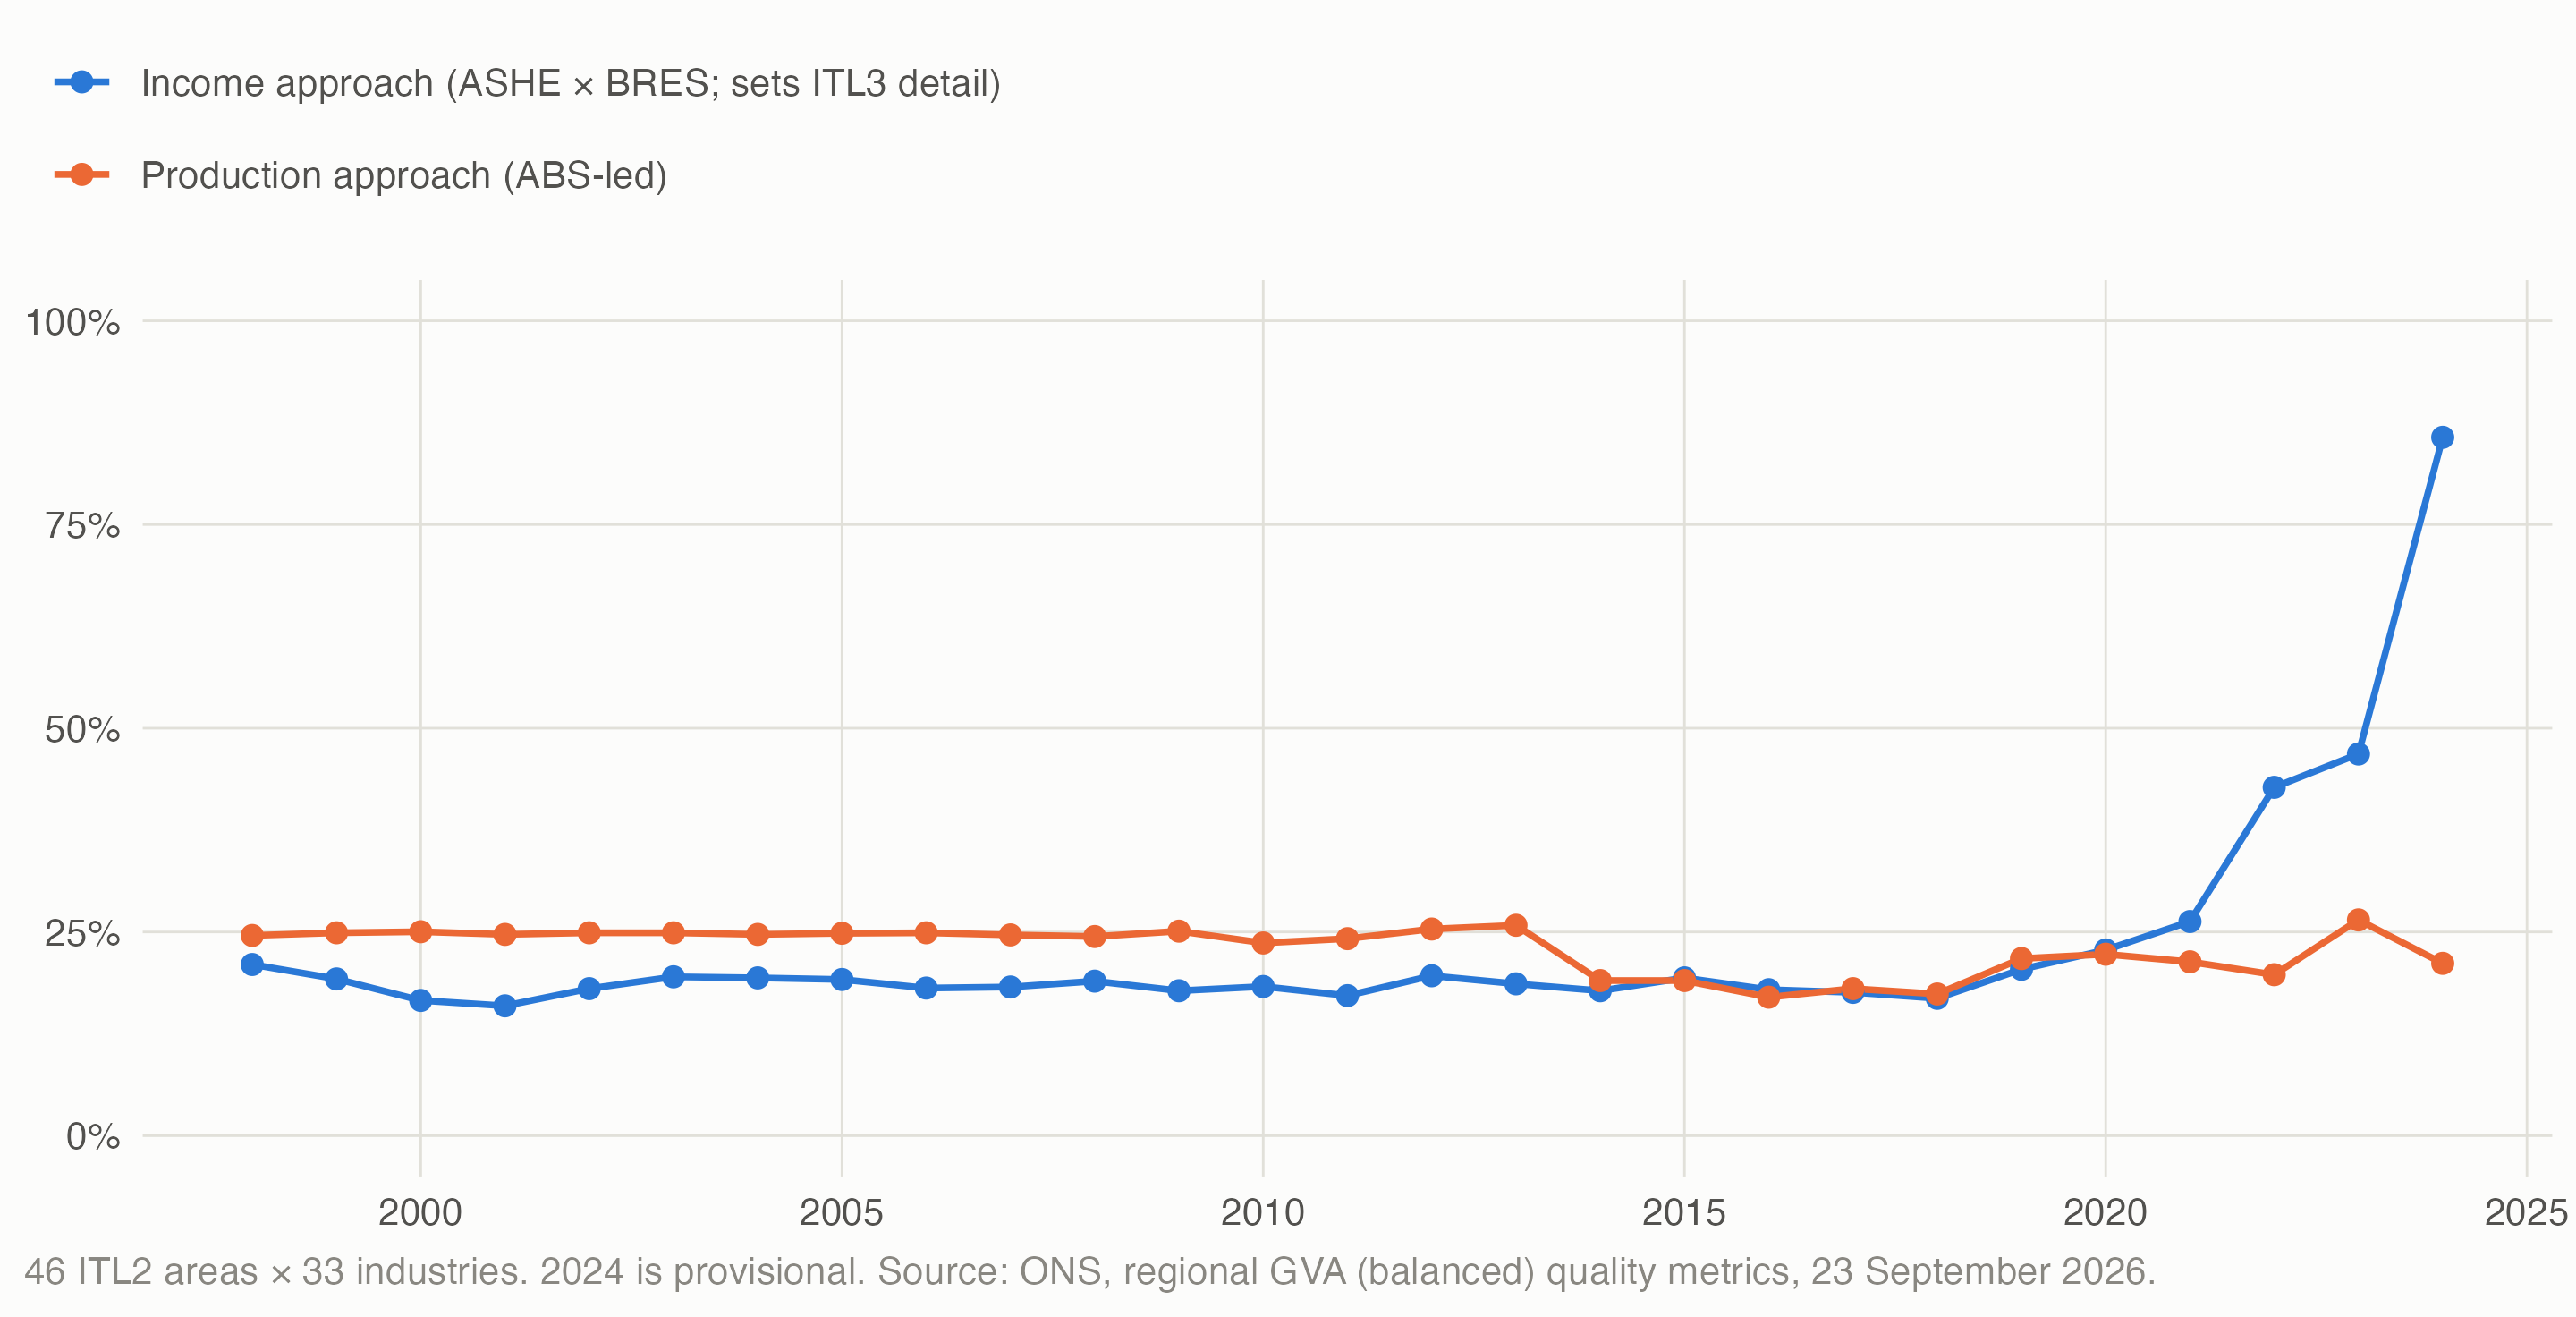
- This is a recent-years story. Scoring 2023’s BRES-linked cells with each year’s metrics, the share of jobs in cells low on the income approach is 2.7% with 2015’s scores, 4.2% with 2019’s and 61% with 2023’s.
- The weakest cells, low on both approaches in 2023, hold 17% of jobs:
| Category | Jobs in weak cells | ITL3 cells | ITL2 areas |
|---|---|---|---|
| Human health activities | 2.33m | 150 | 38 |
| Social work activities | 0.81m | 150 | 38 |
| Residential care activities | 0.67m | 150 | 38 |
| Other personal service activities | 0.23m | 134 | 35 |
| CD-CG (19-23) | 0.22m | 110 | 28 |
| Food and beverage service activities | 0.20m | 22 | 6 |
| Activities of membership organisations | 0.15m | 134 | 35 |
Human health sits on the weakest estimates and its GVA per job tracks pay across regions, so for comparing places it adds little to pay, especially in the latest years.
6 Open questions
- Why do our job counts exceed ONS’s in city centres? ONS’s local jobs may come from the household survey, which counts fewer jobs than employer surveys like BRES; not checked.
- Do ONS’s subregional and INDBYREG jobs include the armed forces? BRES doesn’t. Public administration in the South West and South East, and rural ITL3s with large bases, are where our jobs fall furthest short of ONS’s.
- A site-versus-business classification mismatch? ABS’s regional results classify each site by its own activity. If national-accounts industry totals follow each business’s main activity instead, GVA per BRES job would be understated in head offices, warehousing and wholesale, and overstated in their parents’ industries. The low GVA ÷ aGVA ratios fit; the next test is to compare ABS’s regional results (by site) with its national results (by business).
- Why did the income approach’s quality scores fall from 2022? The file doesn’t say. ASHE and BRES are the inputs.
- Why does circularity fail at ITL1? One reading is that below the 33 balancing industries, ONS takes ITL1 and ITL2 industry detail from the ABS-led production approach, which spreads a firm across its sites by employment. Not confirmed.
- The ITL3 circularity test needs local pay by industry: ASHE Table 7 (all-industry pay by local authority) as a proxy, or secure ASHE microdata.
- Should ONS’s per-cell quality scores travel with the build’s outputs, flagging 2022 onwards? Parked for now (decision 12).
Data and code. A1’s scripts: claude_research/productivity/R/a1_00_fetch.R (downloads), claude_research/productivity/R/a1_01_per_job.R (check 1), claude_research/productivity/R/a1_02_abs.R (check 2), claude_research/productivity/R/a1_03_circularity.R (check 3), claude_research/productivity/R/a1_04_quality.R (check 4), with helpers in claude_research/productivity/R/a1_functions.R; they read the hours build’s outputs (page 2). Sources: ONS regional GVA (balanced) by industry, v13 and the September 2026 release; ONS subregional productivity (June 2025); INDBYREG (July 2021); ABS regional results and quality measures (4 June 2026); ASHE Table 5; Blue Book 2026 supply and use tables (30 October 2026); ONS regional GVA quality metrics (23 September 2026). The landscape: the landscape note, sources checked 2026-11-03.